BY KENT SHAW, CFA
Listening to the market using Implied Revenue Growth
Introduction
In two prior posts, we reviewed several methods for valuing stocks and discussed the strengths and weaknesses of each one of those methods. We investigated the price-to-earnings or “P/E” ratio, the price-to-book value or “P/B” ratio, and the enterprise-to-EBITDA ratio. Those prior posts can be found here: part 1 and part 2.
One fact that is consistent with each of these and, indeed with all conventional valuation ratios, is they are merely symbols that represent a much larger basket of data. Knowing that a stock has a P/E of 12 doesn’t tell you much about the company or what is currently expected from it. The expectations for the company is information that should be examined before investing capital in the company. Fortunately, there is such a tool that considers a company’s expectations, and that is what we’ll focus on here.
The Discounted Cash Flow method
A method of valuation that focuses on the cash an investment is expected to generate is called a discounted cash flow or “DCF”. This method can be used to determine the value of many kinds of investments, including a stock, an expansion of a restaurant, or the development of a new product. The basic premise of the DCF is that cash flows are more valuable when they occur in the near term, and less valuable when they occur in the long term (i.e., you have to wait longer to receive them).
For example, bonds are also valued using a DCF. Bonds pay a regular coupon (interest) payment to the bond holder. The first payment is more valuable to the bond holder than the 30th, or 100th payment (because they receive it sooner), and therefore the earliest payments are discounted less than the future, farther payments. The discount rate itself is a concept we will save for another time.
One major difference between a bond and a stock is that the bond matures. When that occurs, the investor is paid back the face value of the bond, typically $1000. This maturity date is well known and makes the calculation of using a discounted cash flow or DCF model fairly easy.
Cash Flow Margin for a DCF
Stocks, on the other hand, don’t have a maturity date. When valuing a stock, cash flows for 5 to 10 years are estimated and then a terminal value is used to estimate the remaining value of the company based on future expected growth. For our purposes, we will focus on 10 years of estimated cash flows and how they might be generated.
If we want to value a company using the DCF method, one simple way is to evaluate the cash generated in each of the last 5 to 10 years and compare that to the sales in the same year. We’ll call this the cash flow margin. It is a type of profit margin that represents the cash generated from sales that comes into the company and also the money that was spent by the company to support those sales, perhaps to maintain a factory or to open new stores or pay employees.
In a DCF model that uses only two inputs, cash flow margin and revenue growth, we can develop some interesting perspectives. All models have assumptions about the future and there are several assumptions in a DCF model which we won’t discuss here in order to simplify the discussion. Here our primary assumption will be a cash flow margin that does not change over time. A good guide would be the average of the last 5 or 10 years that includes a weaker economic cycle.
Implied Revenue Growth for a DCF
Once we select a cash flow margin, the revenue growth can be changed to estimate the value of the stock. But if we work backwards from the current stock price we can gain some valuable insight. Let’s take our estimate for the cash flow margin, and then use our trusty computer to hunt for the revenue growth that causes the estimated stock price to equal the current stock price. The result is the revenue growth that is implied by the current stock price. In effect, we’re looking to see what’s already been “baked in” to the stock price.
Why would we do that? Well, in the early part of this essay we discussed how a P/E or other valuation ratio doesn’t tell us anything fundamental about the company, it is just a symbol that needs a lot of context. Does a P/E of 12 tell us how much the company is expected to grow or if its profit margin will increase? Unfortunately, a P/E ratio doesn’t give us that insight.
In solving for the implied revenue growth based on the current stock price, we now have a data point that expresses the expectation of the company’s future. We can then compare this expectation to what we know about the company, the industry where it operates, and other factors to determine if we disagree with the market. If the implied revenue growth is overly optimistic, the stock has already priced in this upside, and the company may very well struggle when actual revenue growth doesn’t meet this lofty expectation. On the other hand, if implied revenue growth is especially low, there may be an opportunity for good returns in the stock.
A review of an example should make this easier to understand. Consumer staples companies are those that make goods that consumers use often, tend to be purchased even during recessions, and have more stable cash flow margins. For our example we will use a company that makes a large number of such products. Almost everyone reading this will have at least one of them in their home whether it be diapers, razor blades, or laundry detergent, to name a few.
At the end of 2008, the US stock market had declined significantly and most, if not all, stocks were considered “cheap” relative to their long-term history. We’ll take our first measurement of implied revenue growth for our example company at this point.
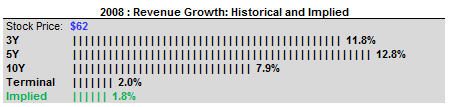
The table below shows the stock was priced around $62 and the bottom row of the table (in green) shows the implied revenue growth was 1.8%. Is that cheap or expensive?
In addition, the table shows us that the revenue growth rate for the prior 10-year (10Y) period was 7.9%. The revenue growth rate for the prior 5-year (5Y) and 3-year (3Y) periods are also shown. Given the context of the company’s historical growth rates, a 1.8% implied growth rate that corresponds to the stock’s $62 price would seem incredibly low. A conservative estimate of even half of the 10Y historical growth rate, or 4%, would mean the stock is still underpriced.
Next, let’s fast forward to the end of 2014. By this time, the market had rallied substantially from the low in 2009 after the end of the bear market. One other major issue was impacting consumer staple stocks like the one in our example: low interest rates. Many investors were desperately looking for stocks that produced income since the income being offered from bonds was very low due to the zero interest rate policy of the Federal Reserve Bank. Many stocks that had stable dividends were trading at very high valuation levels due to the high demand for dividends. This was reflected in traditional valuation multiples like P/E ratios. In most cases, the prices of these stocks reflected a demand for dividends in a very low interest rate environment rather than some fundamental expectation for the company.
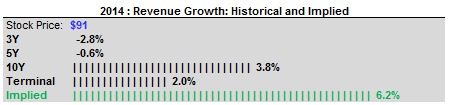
The high, and perhaps unreasonable, valuation was also very apparent in the implied growth model. The table below shows that the stock price was now $91, an increase of 50% from the end of 2008, not including the dividends that would have been received. The table also shows us that the implied revenue growth was 6.2% at the time, almost twice the revenue growth rate that had been experienced over the prior 10 years. There is no guarantee that such a lofty growth rate couldn’t be accomplished but it is highly unlikely given the nature of the business. Consider further that the model shows that even achieving such a high growth rate still wouldn’t offer any upside for the stock, it would simply justify the current stock price of $91. You may also notice that we are roughly 6 years passed our first evaluation and the 5-year (5Y) growth rate is just below zero at -0.6%. This comparison shows that growth has decelerated substantially from 2008 making the 6.2% growth estimate even more unlikely in the absence of some new catalyst for the business.
In 2015, the S&P 500 Index corrected roughly 10% during the summer and our example stock fell 3 times as much during the same period. Attributing stock movements, especially in the short-term, to specific factors is more art than science but it is a reasonable assumption that the high valuation of our example stock was partially to blame for such a large decline. From the low point in 2015, the stock returned to $90 in 2017 and was similarly expensive at that point; a reminder that valuation is a good guide but a poor timing tool.
Conclusion
The implied revenue growth valuation method discussed here is just one of many ways to view a stock and, importantly, understand the fundamental context that might be surrounding the company. It includes something that other valuation methods lack: a direct connection to the performance of the company. Like all valuation methods, it has flaws and limitations but we believe it can be useful as part of a more comprehensive research process. It is often easy to become engrossed in groupthink, especially when sentiment is extreme. A market-based model like this can serve as a proverbial splash of cold water and remind us there is a connection between the company’s performance and the performance of its stock.