BY KENT SHAW, CFA
The P/B Ratio – Additional Distortions
In our prior post, we discussed how share repurchases can impact price-to-book (P/B) ratios. Another distortion that is significant is that of an asset write-down or goodwill impairment. If a company acquires another company, the acquired company is added to the balance sheet of the acquirer. Companies are rarely purchased at book value, however. Often, the acquirer believes they will be able to improve the operations of the purchased company so they will be willing to pay more than book value and more than the current stock price. When a company is acquired, the total value paid is added to the balance sheet of the new company with a portion recorded as physical assets such as a manufacturing plant or a fleet of delivery trucks. Some portion of the price paid that remains after all of the physical assets are accounted for is referred to as “goodwill” and largely represents the additional value the acquiring company believes it will be able to generate with its new purchase. Multiple studies have shown that most acquisitions fail to add value over the long term so perhaps a better name for goodwill would be “good intentions”.
Each year when a company’s financial status is audited, a requirement by the Securities and Exchange Commission, the auditor will review the value of that goodwill. If the performance of the acquired assets is below the expectations at the time it was acquired the auditors may require that the goodwill be written down to a lower value that reflects less optimistic results. This procedure performed by the auditor is called a goodwill impairment test . One trigger for such a consideration is the stock trading below its book value for a significant amount of time, perhaps two quarters. The specifics depend on the auditor. The caution of such a move is admirable, and generally accepted accounting principles (GAAP) are all about caution. However, it’s very important to note that once an impairment occurs, if the business improves, those same assets can never experience a “write-up” or increase in value back to their original levels. This is where the distortion occurs.
Let’s take a look at an example. Dycom Industries (DY) is a medium sized company that performs engineering, maintenance, and installation services for telecom and cable companies. Like most stocks in the bear market of 2008-2009, it declined substantially. For a period in late 2008 and early 2009 the stock traded below its book value (see nearby chart). In the second quarter of 2009, the company was forced to write down goodwill associated with some of its acquisitions. The write-down was $94 million and reduced the company’s book value by 21%, a significant amount. The write-down caused the P/B ratio to increase by almost 30% due to the lower book value in the denominator. Dycom has grown its business successfully since 2009 but the impact of the write-down in 2009 persists. During the period from 2008 to 2009, 158 of the 1500 largest companies in the US experienced a goodwill impairment that reduced their book values by at least 10%. Some companies, such as Delta Airlines, had almost all of their book value eliminated due to impairments. Delta merged with Northwest during that mess and has since improved its profitability dramatically but not all companies bounce back from difficult circumstances. A version of the P/B ratio called price-to-tangible-book-value is sometime used which excludes goodwill from book value. This metric can also cause issues as it assumes that all goodwill is worthless which may not be the case at all. The impact on valuation in these examples is a reminder that good analysis requires many different views of the same situation and an understanding of strengths and weaknesses of the tools being used.
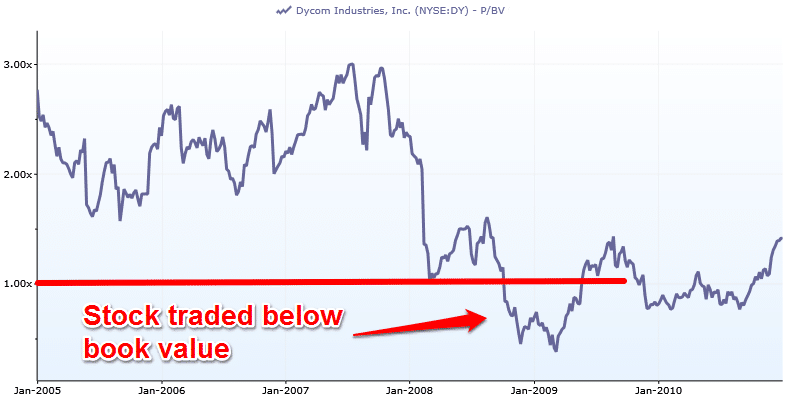
Figure 1 Source: S&P Capital IQ
The P/E Ratio – Additional Distortions
Like the P/B ratio, there are a number of additional distortions that occur in P/E ratios as well that are wise to discuss. We can’t cover them all here so we would like to focus on the most common: high net cash balances. Net cash is simply the cash balance minus any debt the company has outstanding.
High net cash balances are an issue most prevalent in technology companies that tend to have high profit margins. Many small and medium sized technology companies are unable to issue debt at attractive prices because the businesses are seen as less stable than those in other sectors. As a result, they will often accumulate cash over time and some of this cash serves as a safety net for their customers. If a company intends to serve large corporations, those cash reserves signal to the large customers that the company will be able to weather potential difficulties ahead. Once the technology company is large and well established (i.e. less risky) the cash balances have accumulated over a long time and can be quite large. If an entire company were to be acquired, this cash balance is almost like a rebate. The cash has no risk and its value is known perfectly while the value of the company’s other assets are somewhat subjective.
Below is a table of some of the largest US technology companies that have net cash. To correct the P/E ratio, the net cash can be divided by the number of shares outstanding to arrive at a value for the “net cash per share”. Finally, this value is subtracted from the stock price and the result is divided by the earnings per share to arrive at the P/E excluding net cash. In some cases, the impact on the P/E can be quite large. The chart below shows that some P/E ratios would be as much as 20% lower if adjusted for net cash. The mention of these companies is not a buy recommendation but just a current example of the P/E distortion of cash.
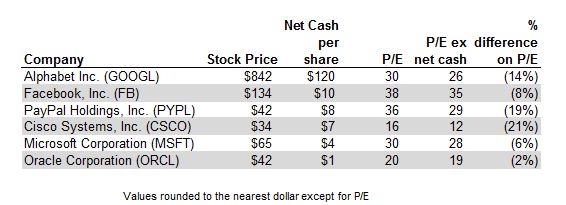
Figure 2 Source: S&P Capital IQ
Part of the reasoning behind removing the cash from the price is that the earnings power of the cash is low which can skew the P/E higher. If we consider that $1 worth of cash is worth exactly $1 in the “P” of the P/E ratio and that the earnings power or the “E” is only 1% (before taxes) in today’s low interest rate environment then the P/E is $1 divided by $0.01 or 100 for that portion of the company. A P/E of 100 is extremely expensive; 4 times higher than the S&P 500. Removing the cash directly from the price is an easier, although approximate, method than assigning different P/E ratios to different parts of the company.
The table below shows the impact of cash balances on the P/E ratio of a theoretical company along with a cash tax rate that varies from its accounting or GAAP tax rate. In the example, the company has the same revenues and profits from its operations at each P/E ratio but only the cash balance and the cash tax rate are varied.
The variance is quite large across the matrix, 50% from the lowest P/E (bottom left) to the highest P/E (top right). These kinds of conditions occur frequently within an industry but are rarely considered by most investors when making comparisons among companies.
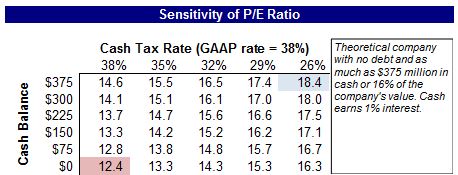
Figure 3 Source: S&P Capital IQ, Kent Shaw, CFA
The Enterprise-to-EBITDA (EV/EBITDA) Ratio
Another valuation ratio that corrects for most of these problems is the ratio of Enterprise Value to EBITDA or EV/EBITDA. Enterprise value is the price paid to purchase the entire company. The enterprise value of a company is calculated by adding the value of all of the company’s stock to the value of the company’s debt and then subtracting any cash it holds. When a company is going to acquire another company the enterprise value is the amount that must be paid. A company cannot simply be acquired for the price of its equity or stock alone. All debt obligations must be taken over by the acquiring company as well.
EBITDA or earnings before interest expense, taxes, depreciation, and amortization closely represents earnings from the company’s actual operations and is not affected by the various tax distortions mentioned in our prior post or by interest payments made to service debt. Depreciation and amortization are non-cash expenses and represent the cost of replacing assets needed to operate the business such as buildings and manufacturing equipment.
EV/EBITDA is not without its flaws, however. It is not useful for valuing financial companies such as banks and insurers because of higher debt and different types of liabilities. It also does not accurately reflect some leased assets such as those often used by retailers. Still, quantitative research by James O’Shaughnessy, founder of O’Shaughnessy Asset Management, shows that EV/EBITDA is superior to other measures of value such as P/B or P/E in building value portfolios. Other academic studies have also supported this conclusion. Finally, I prefer this method because it requires a review of the company’s balance sheet as part of the valuation process. Such reviews can turn up helpful and harmful aspects of a company that might otherwise go unnoticed.
Conclusion
“Cheap” is a relative term, and there are relative ratios and formulas for how to measure the value of one public company’s value to another public company’s value. This article identifies different measures of value as well as some of the pitfalls of considering using some of these ratios exclusively.
While the Enterprise Value/EBITDA multiple is the most robust valuation ratio to use for non-financial companies, one could argue that the best course of action is to consider multiple measures of value when analyzing an equity investment, as long as you know how each ratio calculates “value”.
To read the concluding post of this 3-part series on valuation, click here.