 by
by There has been lots of chirping in the financial press in recent weeks about positive investor sentiment in the market being an indicator of bad things ahead. Let’s take a look at this idea with some actual data. At MONTAG, we believe that making investment decisions based on intuition or compelling narratives can be an expensive and often regrettable plan. We prefer to include a healthy dose of data in our decision process when it’s available.
What is investor sentiment?
Investor sentiment can best be described as how the average investor feels about their portfolio and outlook for the market in the near future. We know that investing for the long-term is wise, but humans are prone to focus on the “now” and give current emotions more weight in the decision process than is often advised. As you might guess, when the stock market is rising, most investors feel positive and when stocks are falling, they are more concerned.
This can be measured a number of ways – using surveys, reviewing the amount of cash in investment accounts, or reviewing data from the options market. Surveys can indicate to us what investors are thinking. A low allocation to cash along with increased allocation to stocks suggests investors are more positive than they were previously. Data from the options market will show if more investors are buying put option contracts to protect their portfolios than were doing so in previous periods. A number of data services combine these kinds of data and publish the results for a fee.
Why should I care?
Average investor sentiment can be a useful tool. But how and, more importantly, when should you use it for decision-making?
The Famous investor, Warren Buffett, summed his thoughts on investor sentiment in this quote: “Be fearful when others are greedy, and be greedy when others are fearful.” Like most things Uncle Warren has shared, there is applicable truth inside but some digging is required to apply it.
Numerous studies over the years have shown that the average investor is prone to buy and sell at inopportune times, often driven by emotions. Ned Davis Research, a longtime research provider to MONTAG, offers a number of models and metrics that measure investor sentiment.
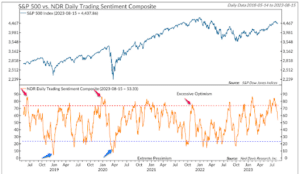
We’ll review one referred to as the Daily Sentiment Composite which includes data from more than 10 sources. This composite ranges from zero to 100 with low values indicating pessimism among investors and high values indicating optimism. With this composite, especially low values (below 15) have occurred at or very near major lows in the market such as the last few weeks of March, 2020. In that example, the market had been dropping quickly for weeks and the news regarding the spread of COVID was dire in terms of the impact on personal health and the health of the global economy. There was very little good news to be found no matter how hard you looked.
This level of extreme pessimism occurred within a few weeks of the low point for the COVID-driven bear market. The following chart , from Ned Davis Research, illustrates this further.
The average investor can also become overly positive after the market has had a nice period of positive returns. Does this mean that when sentiment is positive, we should always be fearful? The same chart below with some new notes shows that it is common for sentiment to be positive when a new uptrend begins. Investors were likely exhausted from the recent market decline, so high optimism may simply be a sign of relief. If investors are positive for the first time in a while, they may be prone to buy more stocks and push the market up further.
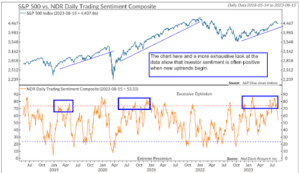
As compelling as the chart above may be, we would like to look at some more hard data to make sure we aren’t being swayed by pretty pictures.
The table below looks at data from similar circumstances from 1995 through 2023 where a new uptrend began recently (less than 1 year ago) and investor sentiment reached a value of 80 or higher. There are several things to note from the results.
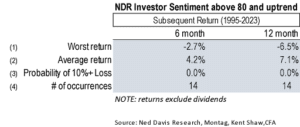
There are only 14 occurrences (row 4) so we should be cautious about drawing sweeping conclusions. More instances would be better but new long-term trends only occur once every two or three years. The first row (“worst return”) shows us that, on average, the worst return experienced in the 6 months after an occurrence of strong positive investor sentiment like this was a loss of 2.7%. That’s a relatively small loss when it comes to equity investing as is the loss of 6.5% for the 12-month period. The average return (row 2) is 4.2% and 7.1% for the 6-month and 12-month periods. This excludes the benefit of dividends which averages around 2.5% per year making this an attractive result. If an estimate for dividends is added, the average return would be close to 5.5% (6-month) and 9.6% (12 month). In row 3, we see that the probability of a loss of 10% or more has been zero, in our data. In other words, these kinds of situations haven’t occurred before major declines. There are no bears in these woods.
Our conclusion after the information shown above is that recent positive investor sentiment is not cause for serious concern. Research and analysis such as this can be helpful for making investment decisions, but no single model or piece of data should drive your decision. We use analysis like this in concert with other information to keep our client portfolios in the lane most appropriate for them.
* * *
The information provided is for illustration purposes only. It is not, and should not be regarded as “investment advice” or as a “recommendation” regarding a course of action to be taken. These analyses have been produced using data provided by third parties and/or public sources. While the information is believed to be reliable, its accuracy cannot be guaranteed.
Any securities identified were selected for illustrative purposes only. Specific securities identified and described may or may not be held in portfolios managed by the Adviser and do not represent all of the securities purchased, sold, or recommended for advisory clients. The reader should not assume that investments in the securities identified and discussed were or will be profitable.