For most of us, it’s been a long time since we were in a math class and, if we ever learned anything about probability, we likely forgot it all once the final exam was turned in. In an age of smartphones and endless apps, thinking about probability might not seem very important, but knowing a small amount could actually help you make better decisions and avoid some pitfalls in business and in life. 
The earliest exposure many of us get to probability is likely to be rolling a 6-sided die while playing a board game with friends or family. The potential outcomes are very clear: a value of 1, 2, 3, 4, 5, or 6 are possible. That’s it. No chance of negative numbers or anything higher than 6. The simple probability here of rolling any specific number is one divided by the number of possible outcomes or 1/6 which is the same as 17% (rounded up for simplicity). However, for most situations in life, the potential outcomes aren’t nearly this clear and we’re forced to look at past events that were similar and then evaluate the outcomes.
Humans have an amazing computational and creative capacity but we also have a few glitches when it comes to decision making and probability. One of these is called recency bias, a behavioral phenomenon discovered in the early 1970’s by Amos Tversky and Daniel Kahneman. Recency bias occurs when individuals give more weight to recent information as they attempt to estimate the future. For example, a sports fan bets on their favorite team because “they always win at home against this opponent” based only on the last 3 years, but never bothering to look at the consistent losses that occurred in the seven years prior to that period. A business owner might assume her new advertisement that was just released a few days ago is an amazing success because her store has twice as many people in it today, not realizing that a tour bus stopped near her store randomly at lunchtime.
In some cases, recent information can be more useful for determining the near-term probability of an event, but some investigation is needed before that kind of assumption should be made. Making a more conservative assumption (lower probability of success) might be the best course, especially if there is capital or other assets being put at risk as a result of the decision.
A lot more could be written about probability but my hope is to share a few instances that are often misunderstood. Because we have an enormous amount of data on sports, let’s start there.
In 2024, the average probability of success for a field goal kick in the NFL was 85%. That’s a very high percentage considering the many different factors involved (for reference, successful passes happen 52% of the time). A field goal is not a “sure thing”, but it is often treated as if it were by fans and coaches alike. In prior years, the success rate for long field goal attempts was much lower – just 36% in the 1980’s. As success has increased, longer attempts have become more common and in 2024, 72% of the field goal attempts from 50+ yards were successful.
And…here comes the math!
There are an average of 18 games in the NFL (including the playoffs) and an average of 2 field goal kicks per game, per team, for 36 kicks total. With a probability of success of 85%, the probability of failure is clearly 15% or (1 – probability of success). What about two failures in a row? To determine the probability of two successive events occurring, multiply the probabilities together. In this case, the probability of two failures in a row is 15% * 15% = 2.25%. Simple, right?
To further complicate things, consider that two failures in a row might happen at least once during the entire season. There are an average of 32 field goal kicks in a season for a single team so, for this exercise, we’ll assume two kicks in each game. Let’s look at the probability of two kicks to fail in a row. The math for the probability of that failure, at least once during the season, is: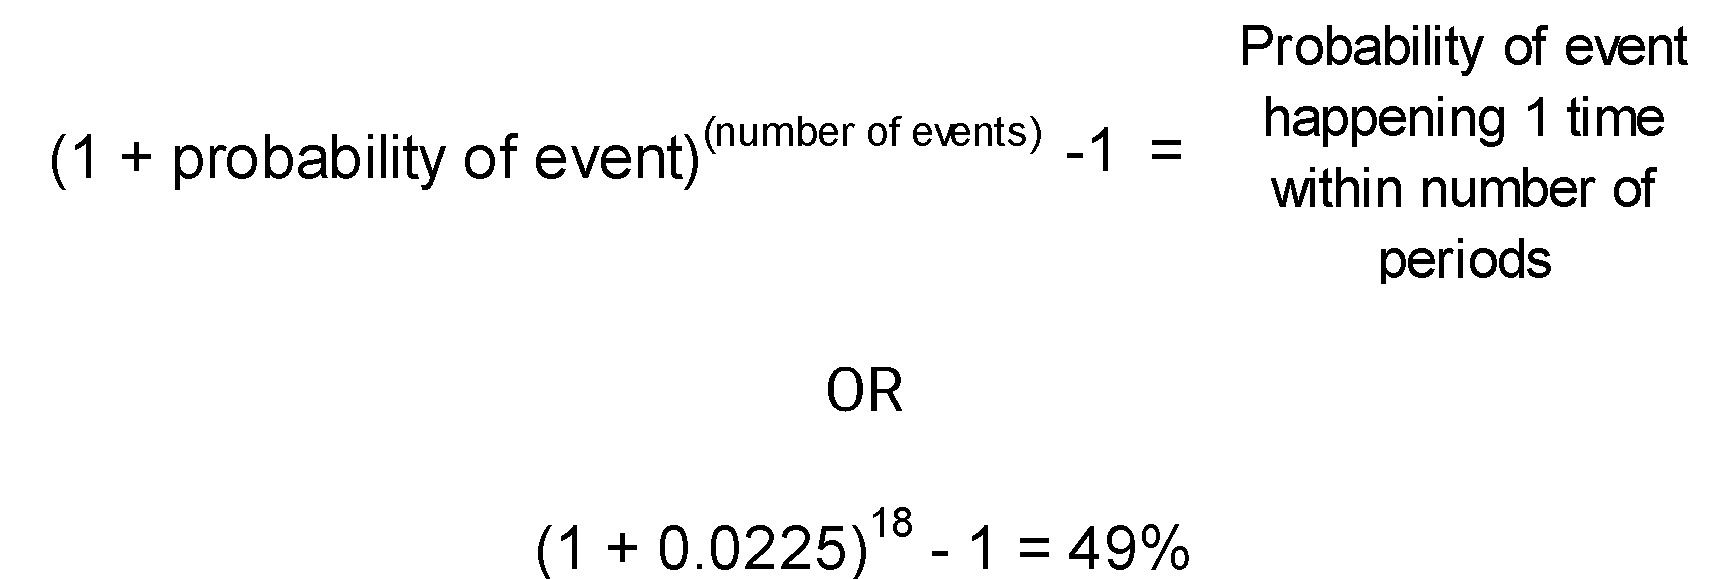
A probability of 87% is high, even above the probability of a field goal percentage we discussed earlier. Most observers would see two failed field goal kicks in a row and deduce that the kicker was in a slump or perhaps he had lost his edge. A coach might even decide not to use his kicker in the next available play when the truth of the probability is that such an occurrence was very likely to occur sometime during the season. High probability events can and do fail to occur. When they fail to occur successively our human nature can cause us to draw flawed conclusions. Takeaway: A small number of occurrences tell us little about the chances of success and failure over the long-term.
So how did the “sure thing” turn into what looks like a “coin flip”? The number of occurrences increased. The probability of a low probability event occurring at least once increases dramatically as the number of events increases. For example, the probability of rolling a six on a 6-sided die that we discussed earlier is 17%. If there are two dice, rolling double sixes (or any double number) is 17% X 17% = 3%. This is similar to the two successive missed field goal kicks. However, if you roll the dice 20 times, the chance of rolling a double-six at least once rises to 77%.
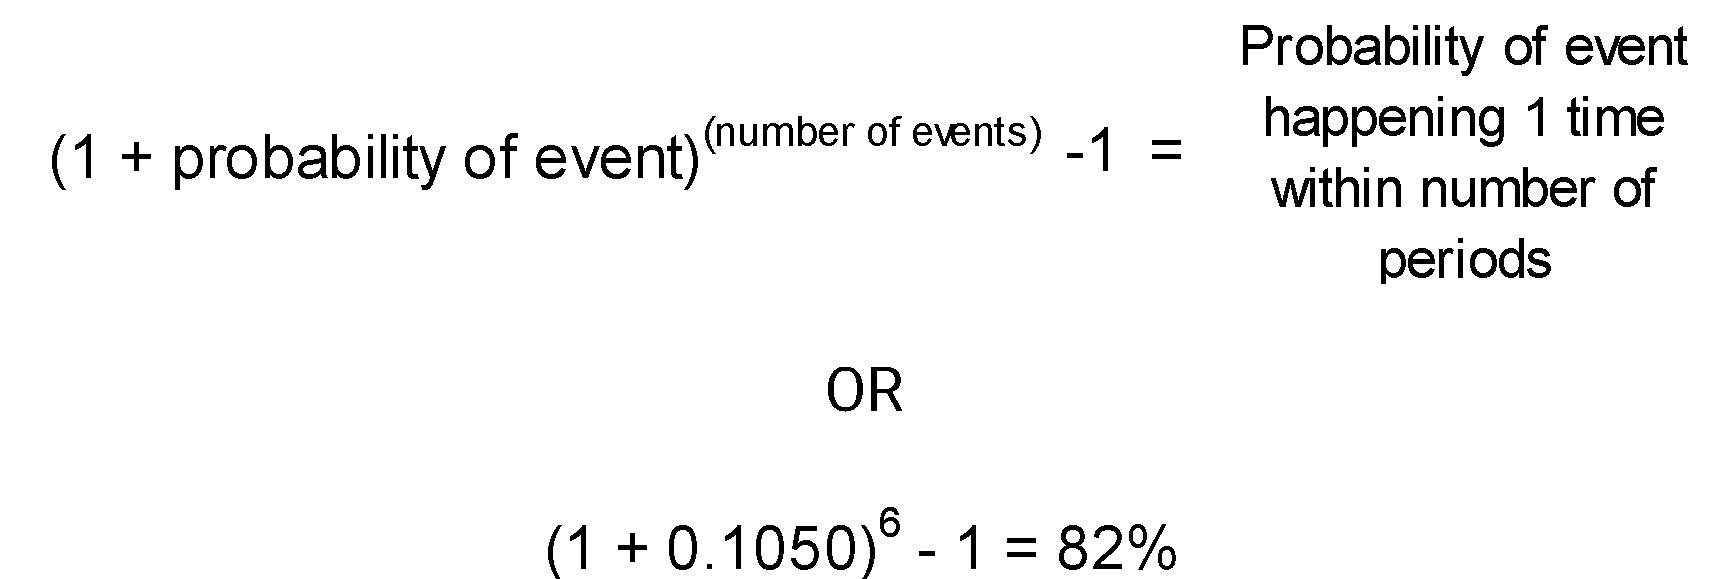
As a final example consider a low probability event that many people see often: car accidents. In 2022, there were 5.9 million car accidents in the U.S., according to the Department of Transportation. In the same period, roughly 3.13 billion miles were driven. If we look at those numbers alone, the probability of being in a car accident on any single mile is very small (about 0.0002%). However, most trips involve more than one mile and, as the number of miles increases, the almost impossible becomes possible. Using the 2022 data to make an estimate, if you drive 40 miles per day in your car, the probability of being in one accident during the year is 2.6%. If we quadruple the accident probability to 10.5% per year for frequent cell phone users and crunch still more numbers, we can see that the chance of such a driver being in a car accident at least once in a 6-year period is 82%. Takeaway: A low probability outcome becomes much more probable as the number of events where that outcome could occur increase.
The complex world of investing is far removed from a simple roll of a 6-sided die, but there are vast amounts of data that can be reviewed. This includes information on individual stocks, industries, changes in interest rates by the Federal Reserve, the impact of a Taylor Swift concert on your favorite company’s biggest sales region. Ok, I made up that last one, but it sure sounds legit.
Bottom line: There is a sea of data out there for anyone looking to make important decisions. At MONTAG Wealth Management, we take the imperfect probabilities we see into account as we make decisions, being careful to remember that the future will rarely look exactly like the past data that we incorporate in our decision process. Probability assessments like the examples given here do not guarantee success, but they can help to reduce the emotion in decision-making and anchor the process to something we can measure. We think this is a very wise step. Reach out to your MONTAG wealth manager, or give us a call if you would like to talk more about how MONTAG Wealth Management uses probability as a tool in wealth management.
Sources:
(1) https://www.inc.com/carmine-gallo/the-mental-flaw-that-will-hold-you-back-from-success-if-you-let-it.html
(2) https://www.cbssports.com/nfl/news/nfl-kickers-missing-more-field-goals-than-normal-in-2024-comparing-current-numbers-to-previous-seasons/
(3) https://www.cbsnews.com/news/nfl-kickers-dramatically-improved-over-the-years/
(4) https://crashstats.nhtsa.dot.gov/Api/Public/Publication/813643#
(5) https://autoaccident.com/cell-phone-use-while-driving-accident-statistics/
The information provided is for illustration purposes only. It is not, and should not be regarded as “investment advice” or as a “recommendation” regarding a course of action to be taken. These analyses have been produced using data provided by third parties and/or public sources. While the information is believed to be reliable, its accuracy cannot be guaranteed. MONTAG employees do not provide legal or tax advice. For specific legal or tax matters, you should consult with your own legal and/or tax advisors. There are risks associated with investing in securities. Investing in stocks, bonds, exchange traded funds, mutual funds, and money market funds involve risk of loss. Loss of principal is possible.