BY BRENDAN WAGNER, Portfolio Manager
A yield curve inversion has preceded every US recession in the past 60 years. As the spread between 10 and 2 year Treasury yields heads toward zero and possibly below, might a recession follow?
There’s a swath of Americans, call it current 35-55 year-olds, who think of only one thing when they hear the word “inverted.” That’s right, they think of the 1986 film Top Gun, and the fictional US Navy combat ace Lieutenant Pete Mitchell’s experience with a pesky Russian MIG fighter, and the piece of “diplomacy” he used to scare off the rival pilot. But for today we’re talking about the potential for the 10 year treasury yield to fall below that of the 2 year treasury, and the potential signals that gives about the economy.
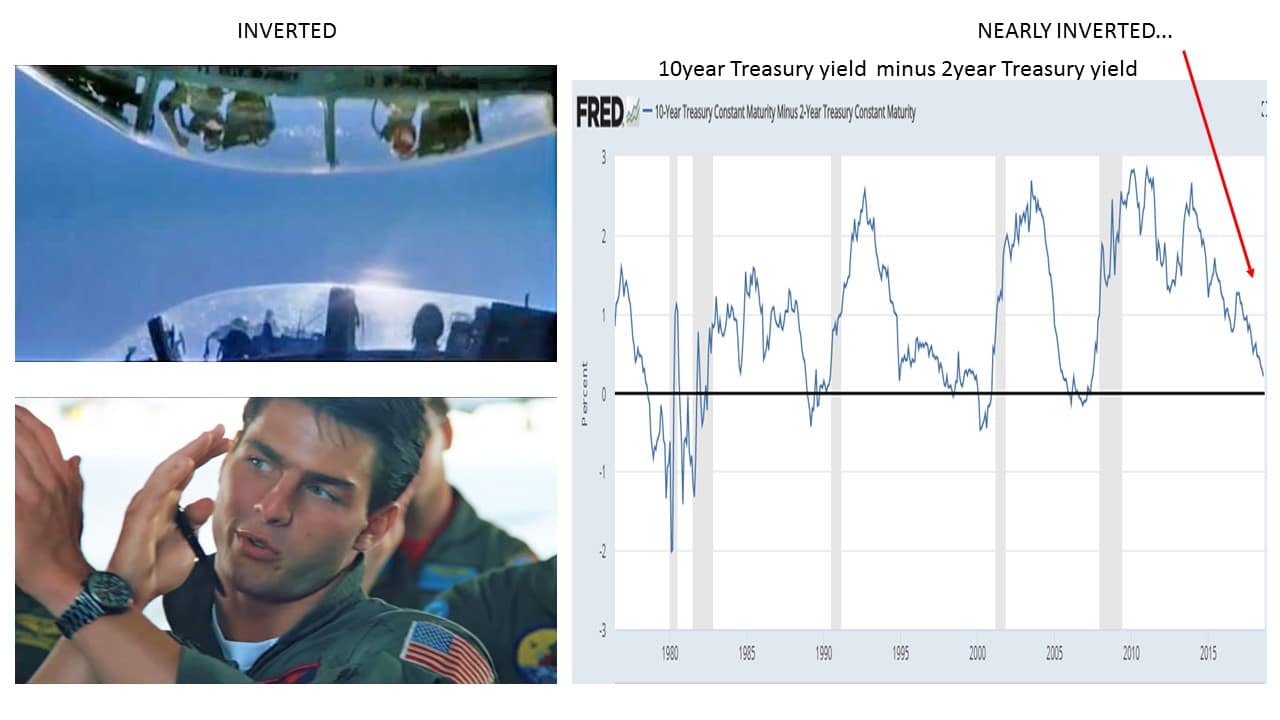
Much ink has been spilled discussing the current difference between the yield on the 10 year US Treasury and that of the 2 year Treasury. Normally, investors demand more yield for lending over longer periods, so when a ten year obligation is priced to yield close to what a two year security yields, it is a sign investors are seeking safety. Additionally, it is a sign that they are rather negative on prospects for the economy over the medium term.
The fact that the 10-2 yield curve has inverted before recessions is not the topic of the day, but rather whether current circumstances are unique enough to mean that “this time is different” for this reliable recession indicator.
By current circumstances I mean the following:
-Federal Reserve interest rate increases pushing the shorter end of the curve higher
-Tax cuts and federal stimulus requiring more borrowing, much of it in short-term securities
-German and Japanese 10 year bonds yielding .3% and .1% respectively – keeping a lid on competing Treasuries
That third factor – the overseas government bonds hovering around zero – really is unique to our current period, and likely the biggest reason why the 10-2 year yield curve inversion, should it occur, may not mean a recession or bear market is imminent.
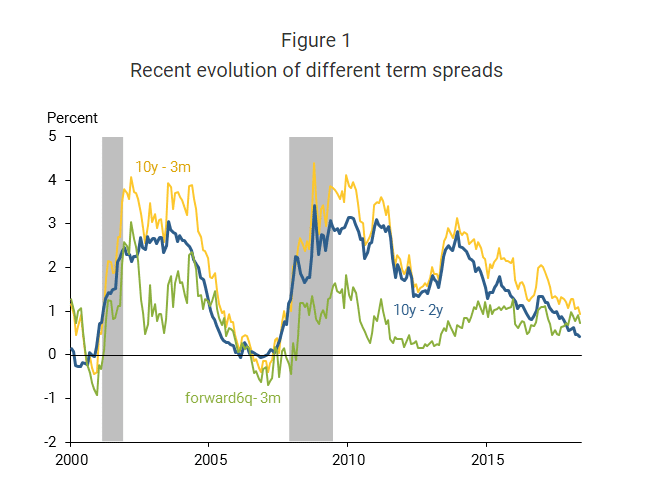
There are a few more things to consider as well. While the financial commentator community focuses on the difference between the 10 year and the 2 years treasury yields, many others who study the subject focus more closely on the difference between the 10 year and the 3 month treasury. In that case, there’s about 60 basis points of breathing room, rather than 20.
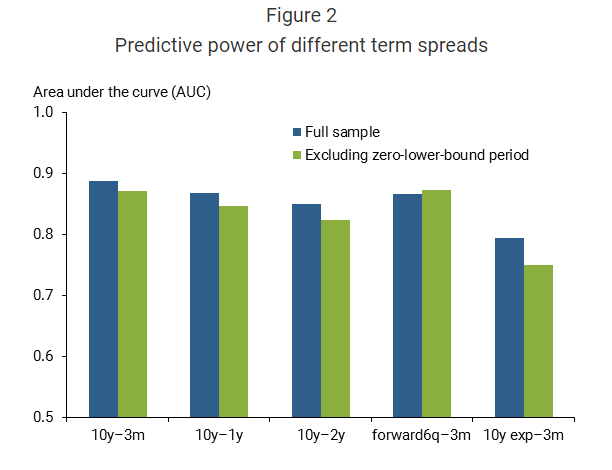
But wait, there’s more! Recent research has suggested the most reliable yield spread indicator might be a comparison much more short term in nature – the difference between forward rates (6 quarters out) and the 3month treasury. This spread, instead of heading towards zero and below, has actually been widening – leading many to see it as a sign of relief that this spread is a good bit further from zero than the 10-2.
The problem with letting one of these indicators give the “all-clear signal” is that, as the same Fed Research letter notes, they’re all pretty reliable, some just a tad more than others:
 Well-respected bond manager Jeffrey Gundlach warns investors not to dismiss the inversion warning, because an inversion at 3ish percent interest rates could be an even more powerful risk-off signal that it was with rates at 5% in 2006.
“There’s a narrative out there that says the flattening yield curve isn’t sending any message about a recession, and that couldn’t be more wrong. In fact, with rates so low, the yield curve signal is even stronger than usual.” https://www.barrons.com/articles/jeffrey-gundlach-were-getting-closer-to-a-recession-1531526581
For any of these indicators to be of any use to us, they need to be actionable with some degree of accuracy, and that likely varies widely based on each investor’s goals, temperament and risk tolerance. For instance, in the case of yield curve inversions followed by recessions, the recessions have begun between 6 months and 24 months after the inversion occurred. So on top of guessing the timeframe between inversion and recession, one needs to also guess at what point the stock market begins its pullback and eventual bottoming- quite a task. I’d rather try to get company quality and deserved valuation right as it’s probably more achievable.
It seems some of these yield indicators are suggesting the economy is in inning 7, while other suggest inning 9. If there is a possibility of rough seas ahead and your portfolio resembles a speedboat, there’s no need to quickly switch to a barge. But maybe re-orient a little bit toward something in the middle, say a solid tugboat?
The information provided is for illustration purposes only. It is not, and should not be regarded as “investment advice” or as a “recommendation” regarding a course of action to be taken. These analyses have been produced using data provided by third parties and/or public sources. While the information is believed to be reliable, its accuracy cannot be guaranteed.