BY BRENDAN WAGNER, Portfolio Manager
The Russia-Ukraine situation is of course top of mind for humanitarian reasons, but in this note we also explore other reasons for market moves in the first two+ months of 2022.
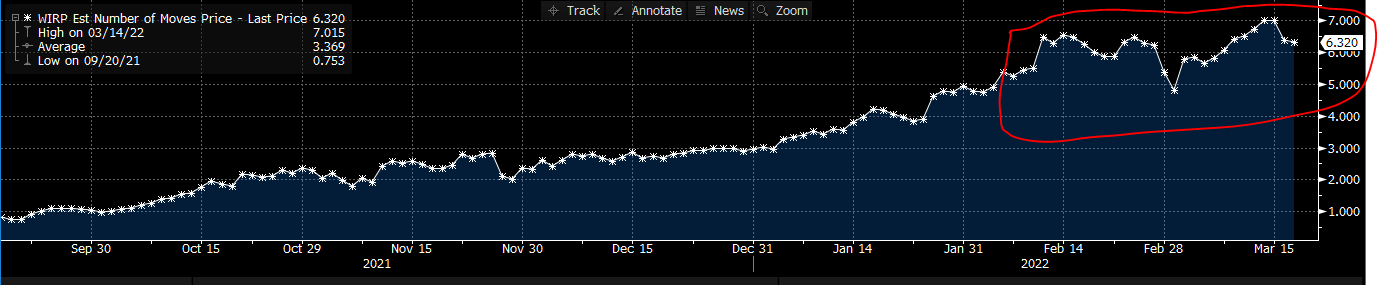
Market expectations of aggressive Fed rate hikes declined as the war broke out, reversing the “Value-beats-Growth” trade quickly, particularly the banks. War, chaos, and catastrophe send people rushing to the safety of the 10-year US Treasury, thus its yield fell 25 basis points in a matter of days, before troughing and now rising to new highs. It remains a tug of war, with, on one side a Fed convinced they can squash inflation with higher rates and less accommodation, versus a global economy’s supply chains, barely recovering from virus-related shutdowns and now facing a war in Europe and energy shocks. Whether or not interest rate hikes can solve a supply-demand and war-driven inflation issue remains to be seen, but the markets believe the Fed will resume the pre-war rate hike plan:
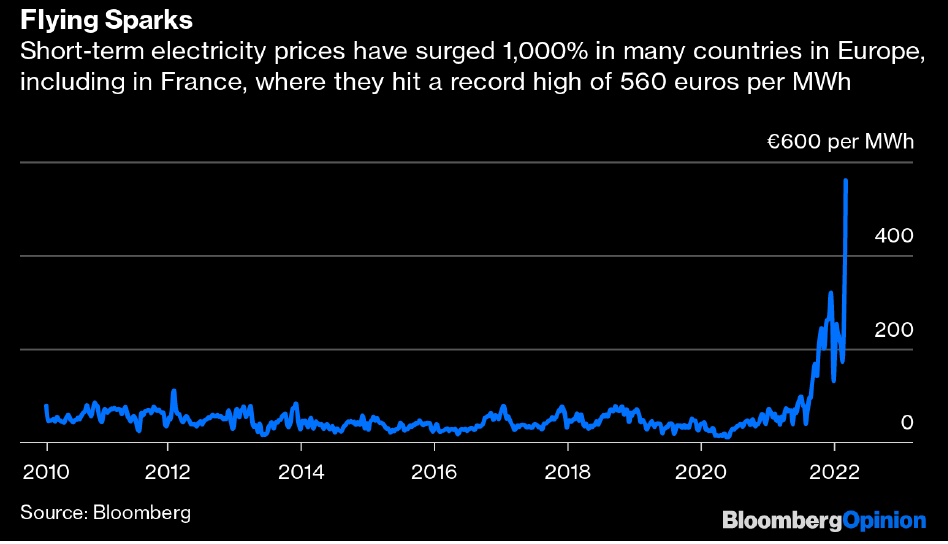
The substantial increase in oil and natural gas prices, down from recent peaks, is a tax on consumer spending, particularly on the lower-income consumer. The increased prices are also hugely detrimental for supply chains and input costs, adding to inflation in all goods, not just fuel. These impacts are more damaging in Europe than the USA, as seen in huge natural gas moves that are impacting electricity prices to such an extent that some materials and chemical businesses are nearly non-viable at these levels. This is missed by many in the political and media class:
While the headwinds from an energy shock get the headlines, other Russian and Ukrainian exports are critical to global agriculture and other industries, particularly in regards to their dominant share of global wheat and fertilizer exports. Half of the wheat purchased by the United Nations for food assistance worldwide comes from Ukraine. As Amanda Little wrote for Bloomberg, “while the U.S. exports about $150 billion annually in food products, it imports nearly as much – about $145 billion.” And although well-off Americans can tolerate higher energy prices, poorer Americans will suffer along with the rest of the world’s working class.
For some US multinationals, exiting business in Russia amounts to asset forfeiture, though currently Russia says they are thinking more of asset sales (to the well-connected) than outright nationalization. That’s not a substantial hit to company value for most multinationals but it shouldn’t be ignored.
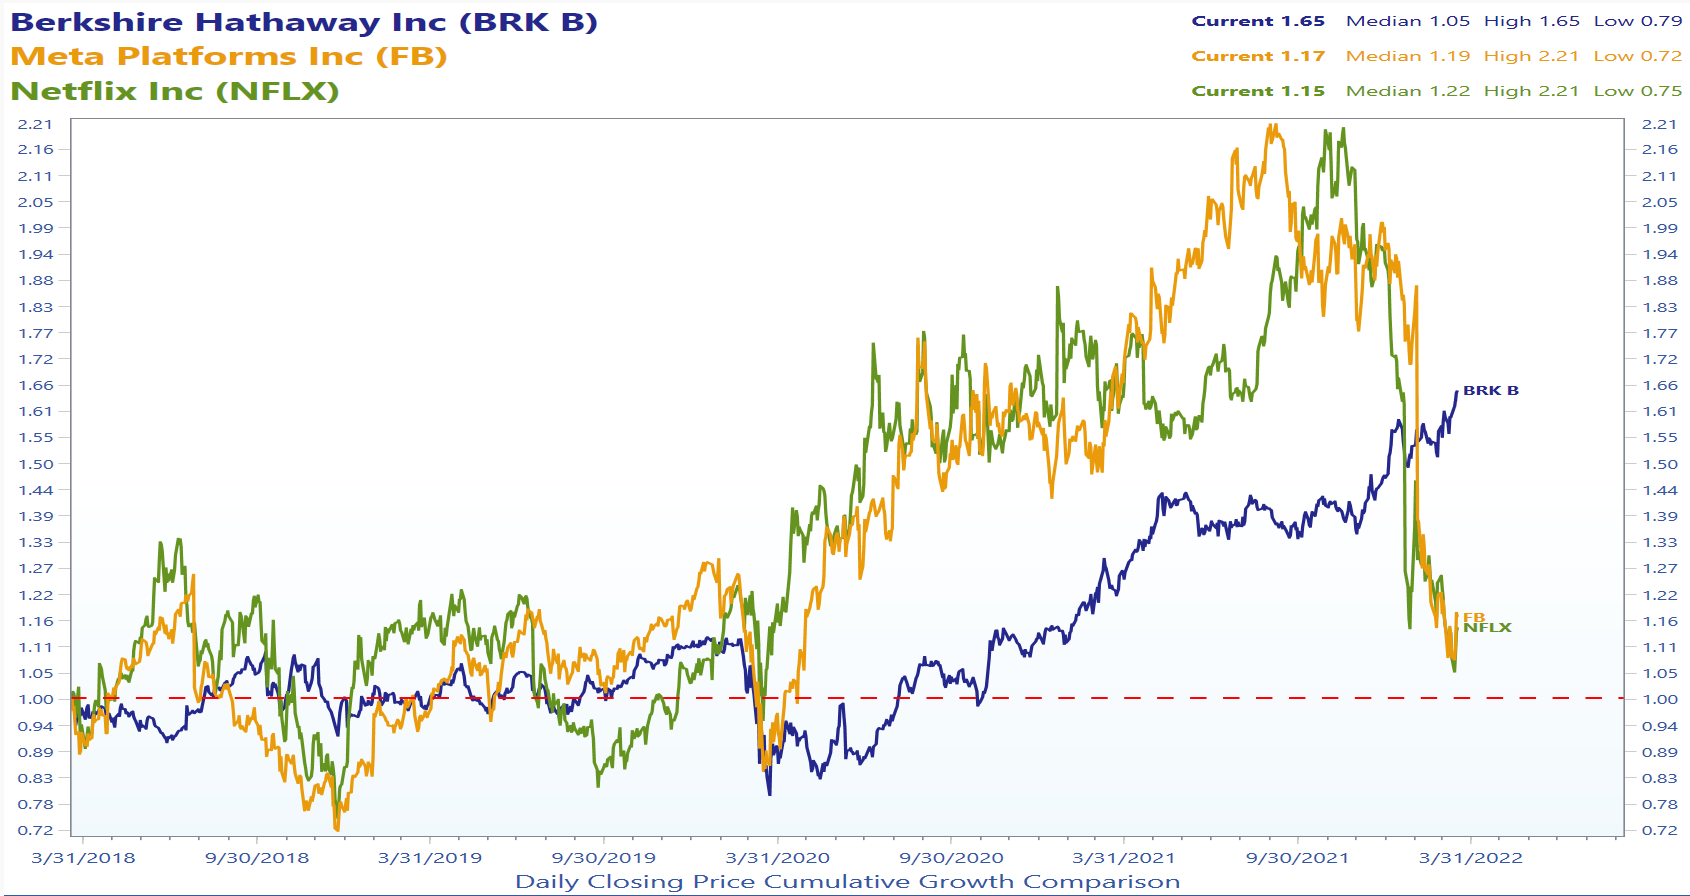
Before the Russia-Ukraine war broke out there was a “repricing” of many high-flying stocks. Note below, high-growth Meta (Facebook) and Netflix, only months ago had been out-performing Berkshire Hathaway, have now given back all relative gains and then some, as the market repriced higher-growth names that showed a hint of deceleration in earnings growth.
Recession in the US? Bear market for equities?
Generally, a recession is defined as two consecutive quarters of negative real GDP growth, and the “REAL” part is critical because it means growth ABOVE INFLATION. With inflation running hot, it does not take much of a slowdown for growth in excess of inflation to turn negative. Is there a US recession ahead, and to what extent has the market already discounted this? While a recession is more certain in Europe, it is becoming more likely in the USA as well, with the possibility of such significant pass-through input cost inflation that demand destruction could be inevitable. That’s likely reality, but it does not mean it’s disastrous for portfolios. The S&P500, down 9% from recent highs, is about halfway towards a 20% bear market. But as for what to do about that, Mark Hulbert wrote for Barron’s in late December 2018:
“This 20% threshold is typically triggered far closer to the end of bear markets than the beginning…in the case of three bear markets since 1980, the 20% threshold was met on the very day the bear market came to an end.”
This snapshot below of the 22 companies comprising 40% of the S&P500 gives some insight as to what extent some of the “damage” has already been done. A good number of companies are off by more than 30% from 52-week highs, burning off a bit of the inflated valuations of the past year. I won’t venture to guess where the downside is for the market as a whole, but the market has begun the process of discounting and pricing in a recession and earnings slowdown.
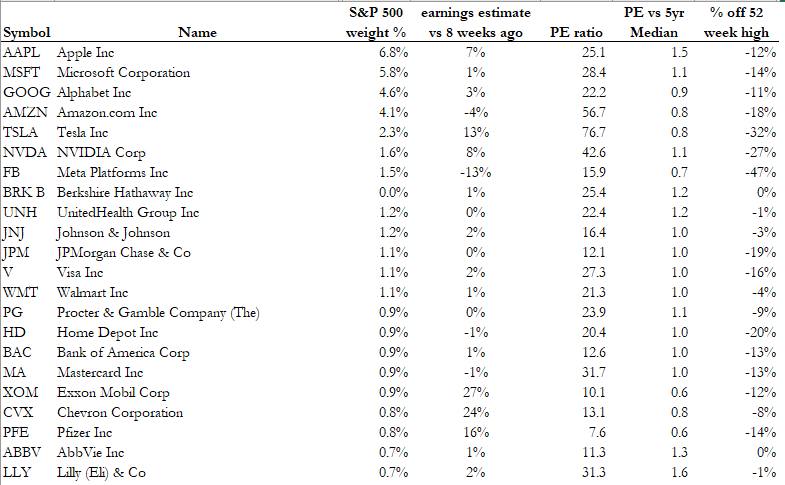
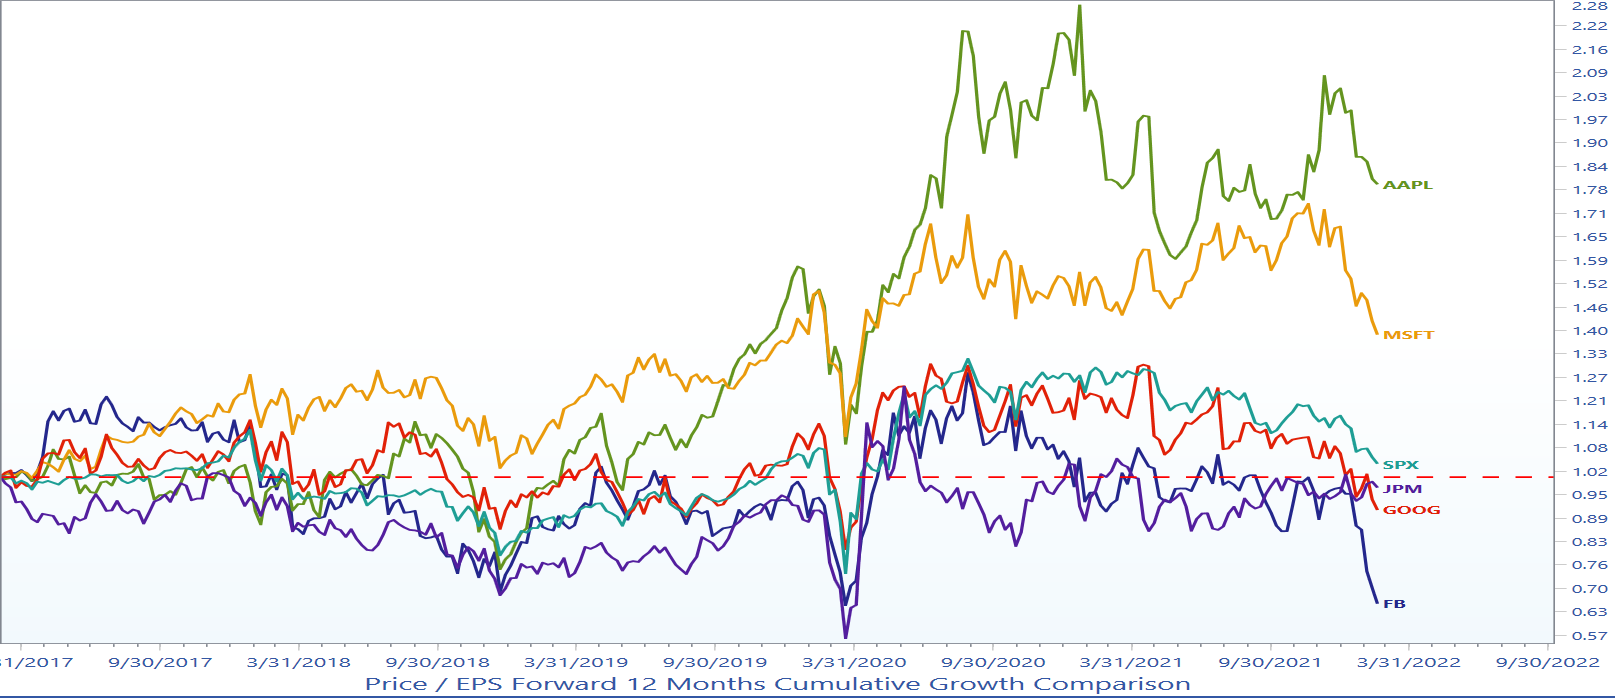
The future investment gains from a stock we buy, or an index of stocks, will be determined largely by two things: How fast they grow earnings (or sales, in some cases of negative-earning high-growth stocks), and the trend in the “excitement level” or Price to Earnings ratio on those earnings. You find a great house to buy, but if you pay $1000 per square foot when the going rate (or eventual correct rate) is $700 per square foot, you won’t make money in the medium term. Below is a snapshot of the relative TREND in PE ratios for some of the largest stocks in the S&P500. Some of the excitement has burned off, while some mega caps like Apple and Microsoft have not given back as much.
One feature of the market has been different levels of volatility in different areas. Some stocks are seeing orderly, “reasonable” repricing of valuation and risks, while others see much larger, more volatile moves. The Chinese tech stocks serve as an example of Templeton’s statement, recently cited by the WSJ’s Jason Zweig, about holding one’s nose and buying right when things feel most uncomfortable. That’s not to say our investors need or should be catching falling knives, but it shows the emotional process of stocks getting truly washed out and ready for a bounce.
“I regarded my own fear as a signal of how dire things were,” said Mr. Templeton, a deeply religious man. “I wasn’t sure they wouldn’t get worse, and in fact they did. But I was quite sure we were close to the point of maximum pessimism.”

A good bit of speculative excess has been burnt off, a positive development for future returns. What remains to be seen is to what extent the market’s larger companies see earnings estimate declines or reductions over time in their excitement levels (PE ratio).
At MONTAG, we remain focused on managing portfolios thoughtfully throughout multiple market cycles. We cannot predict the future, but that does not prevent us from thoughtfully positioning (and when appropriate, repositioning) portfolios and individual positions depending on the opportunities offered up by the manic market.
The information provided is for illustration purposes only. It is not, and should not be regarded as “investment advice” or as a “recommendation” regarding a course of action to be taken. These analyses have been produced using data provided by third parties and/or public sources. While the information is believed to be reliable, its accuracy cannot be guaranteed.
Any securities identified were selected for illustrative purposes only. Specific securities identified and described may or may not be held in portfolios managed by the Adviser and do not represent all of the securities purchased, sold, or recommended for advisory clients. The reader should not assume that investments in the securities identified and discussed were or will be profitable.