BY KENT SHAW, CFA
For the past several years, many in the financial press have been stating, in one way or another, that “value” investing is not working and this market is all about “growth.” From one perspective, they are correct, but from another perspective they are far off the mark, or at least, a bit misinformed about what these terms mean (and represent). This discussion will broach both terminology (value, growth, style) and measurement (free cash flow yield) on their surface, while leaving a more academic discussion on these topics for a future post (I think!)
DEFINITIVELY DEFINING DEFINITIONS
In most discussions, defining terms is important. Academic research papers and legal documents often includes pages and pages of text defining terms so the reader can fully understand the subsequent content while most popular press outlets are more likely to use sound bites and headlines that are short. Using such an abbreviated method can lead to confusion but it makes the reading easy and digestible for the public. Making a ham sandwich is easy (and digestible). Investing is not.
In addition, quite a few journalists are simply parroting what they’ve heard from investors who understand the context while the journalists do not. As such, it becomes almost a game of Telephone, where the message and definition gets muddied and strays from its real meaning by the time it’s distributed via the media.
It is helpful to know that terms like value and growth are often mentioned as an investing “style”. That is, value is one style of investing, and growth is another style of investing and they do have differing characteristics, as defined by certain measurements. There are a number of ways that value or growth stocks are identified including valuation measures such as Price-to-Book-Value (P/B) or Price-to-Earnings (P/E) ratios with value stocks having lower ratios than growth stocks, typically. Stocks may also be separated using trailing or expected earnings growth rates with growth stocks often having higher rates compared to their value brethren.
The chart below shows the performance of the S&P 500 Index, the S&P 500 Value Index, and the S&P 500 Growth Index from 2013 through the end of 2018. It is clear that the growth index was the place to be but does that mean buying value stocks was a bad idea during this period? Was the value style a true underperformer? And what does value even mean, anyway?
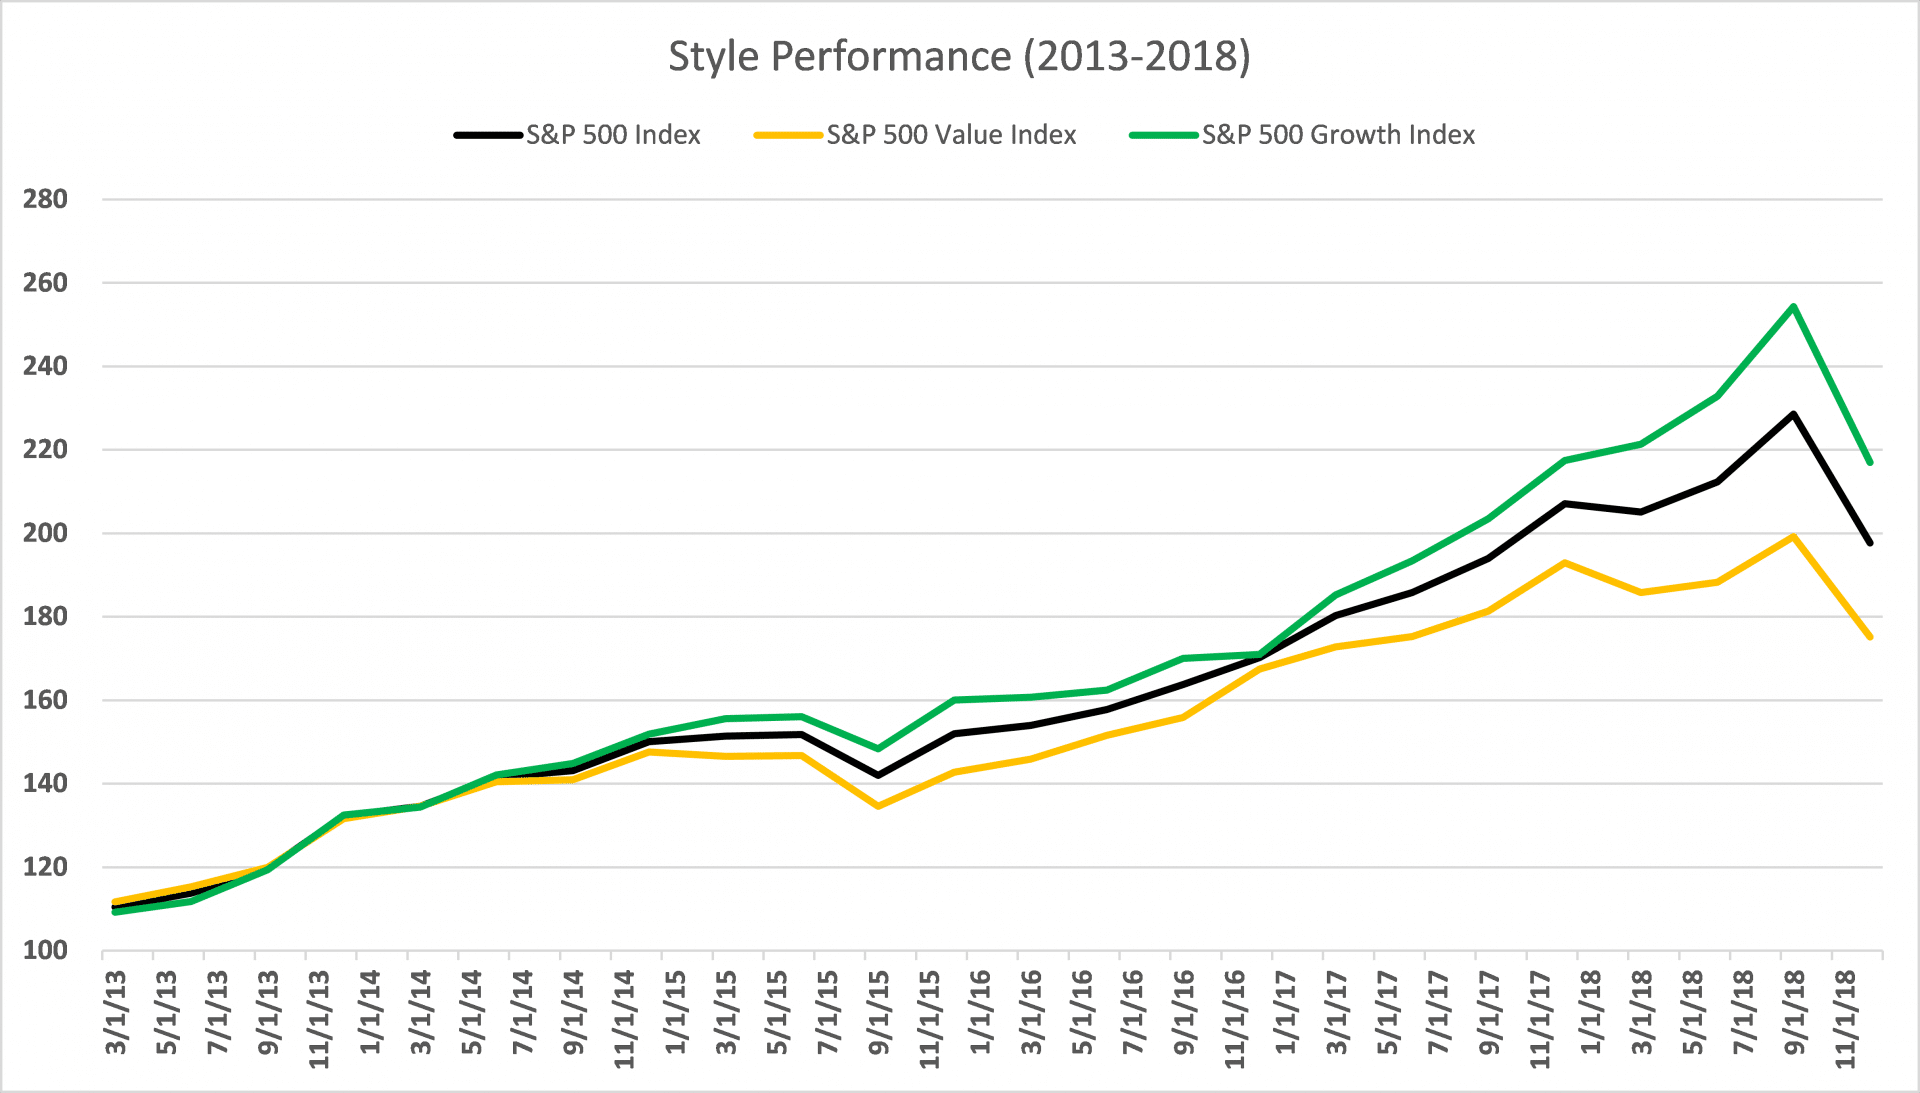
Most of these statements about what is or is not working (i.e., beating the market) are based on the performance of a stock index composed of typical “value” stocks compare to those of a “growth” style. On the surface this sounds like a reasonable method of analysis but it can be fraught with errors. First, as I mentioned in my blog [WHAT IS “CHEAP” AND HOW DO YOU KNOW (PART 1)], some of the measures mentioned above (like P/B and P/E) can be accidentally (or intentionally) distorted due to accounting rules. And second, as illustrated below, comparing a value style index to a growth style index can be more apples vs. oranges than we think.
SECTOR BIAS FOR VALUE VS. GROWTH IN AN INDEX
Within the indexes, stocks fall into various sectors that are designed to describe similar companies or those that are impacted by similar factors. Several of these sectors include Technology, Financials, and Consumer Discretionary. Once the stocks are chosen for the style indexes based on the value and growth rules, there tend to be great differences in the weight of those sectors in each style index. To recap these terms, value stocks tend to be cheaper based on a number of valuation metrics than growth stocks and growth stocks are often expected to generate greater earnings growth in the future than value stocks. A value stock might be one which has declined recently due to an unexpected negative event and an investor may purchase it because they believe the decline is too great relative to the event and that the negative event won’t impact the company’s business over the long-term. A growth stock might be a newer company that has introduced a new product with enormous potential leading the company to grow earnings by 30% in the last year and an investor thinks this growth may continue for a number of years or perhaps even accelerate.
As of this writing, Technology is the largest weight in the S&P 500 Growth Index at 25% but it is only 14% in the Value Index. For the Value Index, Financials is the largest sector at 22% and that sector is only 6% in the Growth Index. As you can see from these different weights, the Value Index is unlikely to beat the Growth Index if the Financial sector is not beating the market. Furthermore, the very low (less than 10%) weight of Financials in the Growth Index gives it an even greater ability to outperform Value if Technology does well and Financials are weaker than the market as a whole. 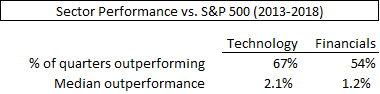 During the period in question, the Financial sector outperformed the broader market in 54% of quarters while Technology outperformed in 67% of quarters. More importantly, the median outperformance was almost twice as large for Technology compared to Financials.
FREE CASH FLOW YIELD
So, if financial ratios to determine value or growth style stocks can be distorted, and value vs. growth style indices exercise an inherent bias in certain sectors, is there anything else for us to consider when looking for, and truly understanding value (vs. growth)?
Well, perhaps. Another measure from the valuation toolbox is a measurement called Free Cash Flow Yield. Free Cash Flow is a number that represents the amount of cash generated by a company after it has invested in the business (i.e., building a new factory or opening new stores). Many professional investors like this measure because it is not typically affected by the many accounting rules that can distort P/E and P/B ratios. If a company’s free cash flow is divided by the value of all of its stock we arrive at a Free Cash Flow Yield. A higher Free Cash Flow Yield number is seen as a good value (cheap) and a low Free Cash Flow Yield number is viewed as more expensive. (It should be noted that financial/bank stocks do not trade on free cash flow yield because they are highly levered companies by definition, so they are a special case, and a discussion for another day.
Empirical Research Partners, a provider of quantitative investment data, states that for the period ending June 30, 2018, large companies with the best Free Cash Flow Yield (cheap) outperformed the broader market by an average of 2.7% for the prior 1, 2, and 5 year periods. During those same periods, the companies with the worst Free Cash Flow Yield (expensive) underperformed the market by an average of 6.1%. Such a disparity in performance between the cheap and expensive sounds like value (vs. growth) is working to us by this measure, but the investor must look further at the company and the possible drivers of performance for the stock.
FREE CASH FLOW YIELD — An Example
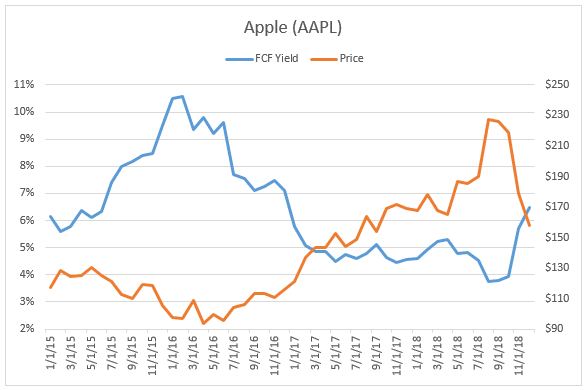
A single example can be misleading but we’ll risk it to prove a point. In the first half of 2016, Apple (AAPL) was trading at a Free Cash Flow Yield of more than 9%, easily putting it into the value category when compared to other companies while also being in the Technology sector (remember, I just told you Technology is a growth darling). The stock handily outperformed the broader market in the subsequent 2-year period.
CONCLUSION
While most people can generally agree on what growth and value mean, it’s important to consider what goes into an analysis when comparing the two. As illustrated in the comparison of the S&P Value Index vs. the S&P Growth Index, they are constituted entirely differently, and therefore don’t lead to a straightforward comparative analysis.
Further, comparative ratios may posit that one style is performing better than the other, while other ratios may yield the opposite result. Or in the case with Apple, the Free Cash Flow Yield makes the stock look like a value stock while most would consider it a growth stock (as the S&P Growth Index does).
The compare-and-contrast examples above lead us to this conclusion: We do not believe that any single method or fundamental measure works in every circumstance. Like many situations in life, context is important and digging below the surface can yield many benefits including positive opportunities and the avoidance of negative events.  The discussion of the Value and Growth Indexes and what they do and do not reveal highlights another important point: shortcuts in investing can lead to missed opportunities. The surface conclusion says “value isn’t working” but further analysis reveals something quite different. It is impossible to know all of the details of every investment but we believe looking under the hood for more details is worthwhile.
NOTE:
The information provided is for illustration purposes only. It is not, and should not be regarded as “investment advice” or as a “recommendation” regarding a course of action to be taken. These analyses have been produced using data provided by third parties and/or public sources. While the information is believed to be reliable, its accuracy cannot be guaranteed.
Any securities identified were selected for illustrative purposes only. Specific securities identified and described may or may not be held in portfolios managed by the Adviser and do not represent all of the securities purchased, sold, or recommended for advisory clients. The reader should not assume that investments in the securities identified and discussed were or will be profitable.