This letter includes two parts; one part, below, which is our standard review, and a second part, titled A Historical Review, following the conclusion of this letter, written for anyone with more appetite on the topic of stock market investing. We hope you enjoy both.
As you may know, in the third quarter, all three major U.S. stock market indices were negative. The S&P 500, Dow Jones Industrials, and the NASDAQ Composite declined 6.9%, 7.6%, and 7.4%, respectively (excluding dividends).
Interest rates declined in contrast to the expectations of a Federal Reserve rate increase. The yield on 10-year Treasuries ended the quarter at 2.04% compared to 2.35% at the end of the second quarter.
IN THE NEWS
China has been a frequent topic of concern during the quarter as the Chinese government spent over $200 billion trying to stem the decline of its stock market. The Shanghai Composite Index peaked in late June after doubling in less than a year and has fallen 41% since then with a few pauses due to government intervention.
The Chinese government has been concerned about more than the stock market as there are indications the economy is slowing and may be unable to maintain the 7% growth target set by decision makers. Leaders within the country are attempting to steer the economy away from growth dominated by manufacturing and exports and more towards domestic consumption and services. The transition, if successful, will take many years but there is hope that the end result will be a more stable economy. To support the transition, the government has devalued the Chinese currency several times in the past few months in an effort to lower the cost of exported goods and spur demand. In 2015, the government has spent hundreds of billions of dollars to build roads, bridges, and other infrastructure. Some economists believe leaders may spend more than $1 trillion over the next few years in an effort to support the economy during the transition. Outside of China many economists and investors fear any slowdown in China will negatively impact global growth as China is the only large economy growing significantly.
Another major story during the quarter is the Federal Reserve’s decision to keep interest rates unchanged. Early in the year, the expectation was building that the Fed would raise rates by September based on steady employment improvement and GDP growth in the US. By this summer, that sentiment started to erode as there were additional concerns regarding a bailout of Greece and, more recently, turmoil surrounding the slowing Chinese economy which many believe sparked weakness in the US stock market. Chairwoman Janet Yellen stated after the Fed’s meeting that the Fed wanted to wait to see what impact these global developments would have on the US economy before acting. Part of the Fed’s mandate is to maintain a 2% inflation target for the US economy.
HOW DOES THIS AFFECT OUR INVESTMENT THINKING?
Our expectations for returns of the US equity market are driven by the earnings expected of companies in 2016 and the amount that investors are paying for these earnings. Expectations are always based on assumptions and various methods of calculation. There are many ways to calculate return expectations, with benefits for each method. One established method is known as the build-up method, where various components of shareholder returns are calculated. One of the most important components is the multiplier of the estimated earnings, often referred to simply as the “multiple.” The higher the multiple, the more expensive a market or stock is said to be. The multiple is often referred to as a measure of “valuation.” Many research studies show the most important factor in future returns of an investment is the valuation at the time of purchase. High quality companies purchased at expensive valuations often produce poor returns. Warren Buffett said it best: “It’s far better to buy a wonderful company at a fair price than a fair company at a wonderful price.” See our A Historical Review reading with this letter for more about valuation in determining returns.
As we look at the US stock market, using the S&P 500 Index as our proxy, the index had a value of 1,920 at the end of the third quarter with a P/E ratio (or multiple) of 17. The average of analysts’ expectations suggests that combined earnings for the companies in the index will grow 14% by the end of 2016. The same estimates indicate revenues will grow at only 5% during that time. In the last 4 years earnings have never grown more than 4% above revenue as most companies have been trimming costs for many years, and their ability to do so is diminishing. Thus, earnings growth much more than 9% may be more than optimistic. The P/E ratio isn’t likely to increase if earnings growth is lower than some expect. Since 2009, the P/E ratio for the S&P 500 Index has risen from 14 to a peak of 18, a 30% increase, before declining this quarter to 17. Further expansion of the P/E is possible but is unlikely without strong fundamental improvement. The current bull market is now in its seventh year, an old-timer by any measure, so we believe tempered expectations are prudent. We can sum this up with a quote from, Yogi Berra, a recently departed hero of American culture: “The future ain’t what it used to be.”
Stock prices have declined since our last letter and many stocks have declined by 20% or more, a far greater decline than the market indices. US stock valuations are above historical norms, but there are few alternatives for investor seeking an attractive return. Bond yields are low, historically speaking, as is inflation, but there is no clear catalyst to drive interest rates materially higher. Our equity research process is one of searching for high quality companies that can be purchased for prices that are below their true value and potential. In the past few quarters, finding such companies has become increasingly difficult and, as a result, we have made fewer changes to portfolios. We let our process guide us, as it has for many years, which may lead to reduced equity exposure and higher cash balances from time to time. We manage the assets entrusted to us with a long-term view and strong desire to manage risk in challenging markets.
We welcome your thoughts and comments and are honored that you have chosen MONTAG to manage your investments. We hope the additional material, focusing on the importance of valuation and expectations, is useful to you.
A HISTORICAL REVIEW AUTUMN 2015
In support of our prior discussion of the US market, let’s review an example of a good company with a high multiple or expensive valuation. Typically, individual stocks are discussed in terms of price-to-earnings ratios also called P/E multiples which is simply the price of the stock divided by the earnings per share of the last 12 months. It is often assumed that higher P/E ratios indicate a higher earnings growth rate for a company but it’s not that simple.
Why? Earnings, even for good companies, frequently have non-recurring items or other aberrations caused by accounting rules. Company management teams typically dissect earnings so investors can see what management believes to be a clearer picture. The noise generated by these non-recurring items cause the relationship between P/E and earnings to also be noisy. In a perfect world, without such noise, we tend to see P/E ratios increase for companies with higher growth and higher quality businesses such as those that can make more money with fewer assets than their peers.
Determining what will drive a stock’s P/E higher is at least as much art as it is science as there are a number of factors that can add noise to the economic picture of a company. We may present a discussion of some of the items that can lead to increasing multiples in future letters. Now let’s review a company familiar to everyone: Wal-Mart.
Wal-Mart is the largest retailer on planet earth and it has been a darling of Wall Street for many years but darling status doesn’t necessarily produce positive stock returns. The chart below shows annual data For Wal-Mart from 1996 through 2011. The blue line indicates the average P/E ratio during each year, the black line is the average price, and columns at the bottom indicate earnings per share.
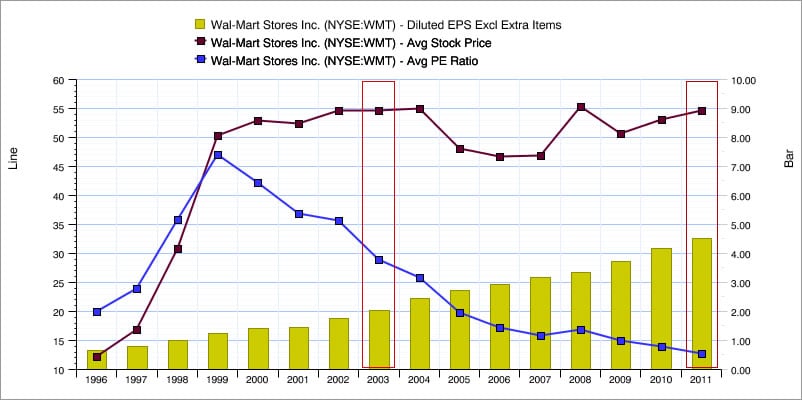
Source: S&P Capital IQ
After the bear market ended in 2003 there were quite a few deals to be had in the market. Some investors believed Wal-Mart was one of them. In 2003, the P/E ratio was at 30, a third lower than its peak of 46 in 1999 which sounded like a good value at the time. This high P/E of 30 represented high expectations for the company’s future results. While Wal-Mart did produce growth in earnings of almost 11% per year from 2003-2011, the P/E contracted by almost the same amount per year (note the decline). The net result was a return of zero, if dividends are excluded, for that 8-year period. Wal-Mart had solid earnings growth and quality was high but the price paid was too high so the net return was poor. The results remind us of Mr. Buffett’s quote mentioned earlier. In some respects, this is where we find ourselves in terms of valuation for the US stock market; a higher than average valuation with modest prospects.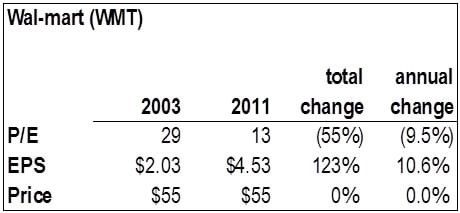
Click here for Montag’s website disclosure.