By CHRISTINE R. QUILLIAN, CFA, CFP®
“Experience is a comb life gives you after you lose your hair.” – Judith Stern
After stocks’ worst-ever start to a calendar year, now is a good time to remind ourselves why investors volunteer to persist through this hair-raising volatility.
Why own stocks?
Reason #1 – Growth well ahead of inflation: across a broad menu of investment choices, stocks have a strong long-term performance track record, returning about 10% annually since 1926.
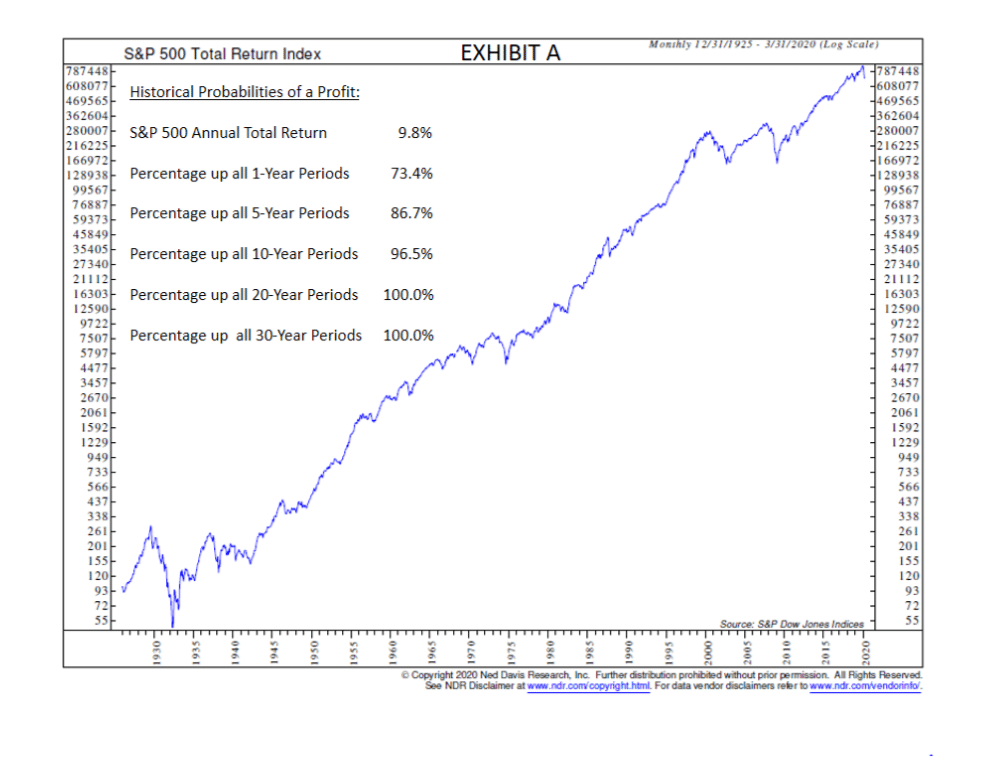
Reason #2 – Stock prices trend upward over the long-term: the historical probability of a profit across most investors’ long-term time horizons is high, as can be seen in Exhibit A. (Click on the chart for better viewing)
If stocks are so great, then why do investors feel so behind?
- The starting point matters a LOT: the so-called 10% expected return is impressive, but in-the-moment results vary greatly.

Time in the market is critical to compound returns over very long-term time periods. However, just because the EPA rates a vehicle for 28 miles-per-gallon (MPG), personal driving habits, unpredictable traffic and messy road conditions mean “your personal mileage will vary!” Begin the journey on a newly-paved, straight-line road with zero traffic and miles-per-gallon will soar above that average number. Get caught in rainy-day gridlock, or spend time on gravel roads dodging potholes, and 17 MPG might be a good day.
- Remember this: average or median signals that a given number is in the middle of a pack. Roughly half the other numbers are higher, and half are lower. A starting point with recent “above average” history indicates that – whether we like it or not – returns have a good chance of being “below average” at some future point.
Fortunately for stock investors, after a miserable start to 2020, the reverse may also be true.
Take a look at the two charts below, Exhibits B and C. The arrows point to select years when an investor might have begun to invest for the first time or otherwise started the clock ticking on a measurement period. The down arrows mark years after big run ups in stocks; “the train is leaving the station, investors better get on now!”
(Click on the charts for better viewing)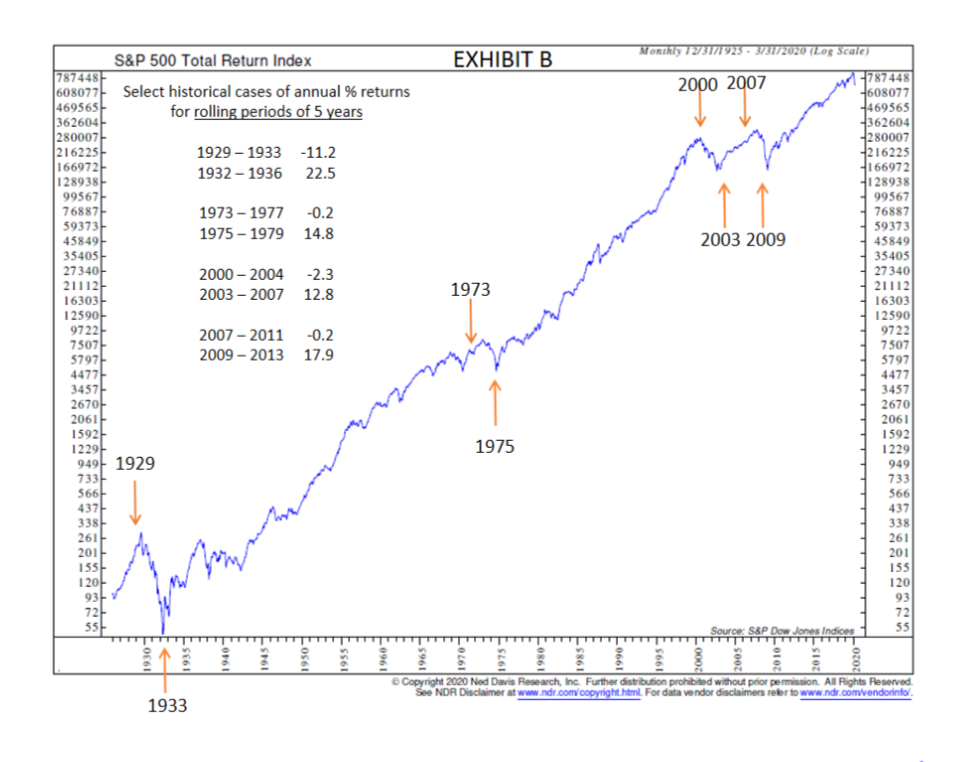 Except that instead of continued above average gains, those investors experienced the opposite of what had been a recent norm: after several years of big gains, it was hard to make money in stocks, and the expectation of 10%+ annualized returns vaporized.
Fast forward a few years into the midst of those below-average return periods. At the very time when recent experience convinced many investors that stocks were a loser’s game, the curtain was rising on a new bull market. After demoralizing declines, the up arrows mark years when stock investors were on the cusp of terrific, above-average, annualized performance.
Hold on to this encouragement as you study the table below for what a difference a single quarter can make:
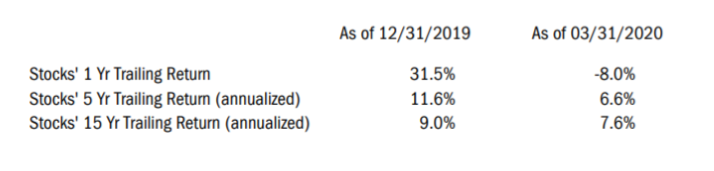
Point #1: the inclusion of a single quarter of big up or down returns has significant impact on short measurement periods.
Point #2: the impact of any one quarter is modest in the context of longer time frames.
- Weakness begets strength. Ned Davis Research observes that, since 1926, when the S&P 500 Index has declined at least 15%, the following quarter sees the index climb “67% of the time by a median of 5.8%. One year later, the median gain is 17.3%.”
It will be a while yet before we can say March 23, 2020 was “the bottom” or only “a bottom.” With Covid-19 creating real unknowns on a global scale, governments and central banks have pledged to do whatever is necessary, using borrowed money, to keep economies afloat. It is possible that recent stock market gains are a head-fake, and investors could become concerned about the ability of the governments to fund this new version of the status quo.
Our takeaway is that unless the global economy is entering a depression, then the stock market was deeply oversold in late March and had priced in a lot of bad news. At the moment (April 9, 2020) stocks may be short-term overbought and near-term vulnerable to unexpected negative news. Ultimately, equity prices look ahead and are likely to move higher in anticipation of subsiding coronavirus worries and resumption of global economic activity.