BY KENT SHAW, CFA
After a nice rebound in the market in the middle of February we have experienced three consecutive daily drops in the S&P 500 Index of 1% or more. During 2017, such declines were very rare but in the greater expanse of market history, they are quite common. We have spoken about the unusually low volatility we experienced in 2017. During 2017, the S&P 500 Index had positive returns every single month. That was the first year in history for such a positive streak and a feat unlikely to be repeated soon.
A re-test is likely underway. What’s a “re-test” anyway?
When the stock market experiences a correction within a rising trend, it is common for it to fall, rise again in a short-term bounce, and then fall back to the low level of the first fall. This is often referred to as “retest” as the market is retesting the price level that it fell to previously. There are two examples of such behavior shown below; one in 2010 and another in 2011. This also occurred in late 2015 and again in early 2016. Based on declines in recent days, we suspect we will experience a retest of the low in February sometime in the next few weeks.
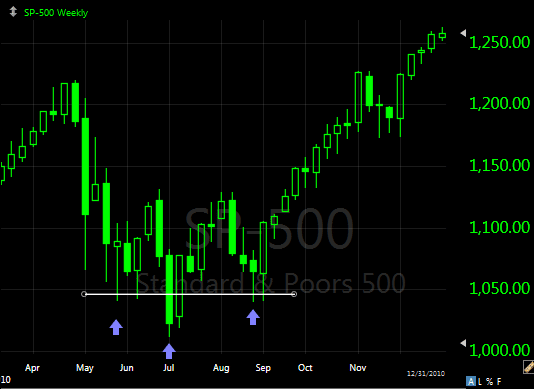
Source: TC2000
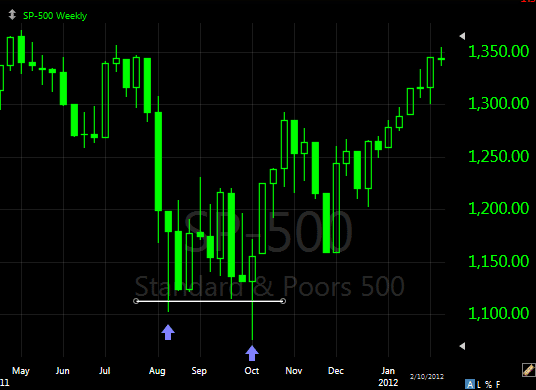
Source: TC2000
The earnings scorecard
It is often said the stock market is driven by the earnings of companies. This seems to make sense but it isn’t always true. Charlie Billelo of Pension Partners recently shared research that the stock market and earnings have moved in the same direction around 80% of the time since 1989. That’s a strong relationship but we must always be on the lookout for the exceptions to the rule as well. When the market has not moved in the same direction as earnings it was due to a change in the price multiple or the amount that investors were willing to pay for those earnings. In other words, stocks were very cheap and investors were willing to pay a higher multiple for expected changes (the multiple expanded) or stocks were expensive and investors were concerned that the great results just attained weren’t likely to repeat or improve further (the multiple contracted).
As of this past week, FactSet, an institutional research service, reported that 90% of the companies in the S&P 500 have reported earnings for the most recent quarter. Of those, 74% reported earnings above expectations and 78% reported sales above what was expected. This is a positive development and generally supports the notion that stocks will continue to rise this year. However, the average return for the stocks that produced positive earnings surprises was actually negative (-0.5%). On average, investors heard great news but rather than buy more, they sold. This bears watching and could signal a shift in market sentiment and produce a disconnect noted in the prior paragraph between earnings growth and stock performance.
Many signs of stability in the capital markets
One measure we watch closely is the behavior of low-quality bonds compared to US government bonds. Low-quality bonds are much riskier, and offer a higher yield, than government bonds but when economic conditions are good and investors are comfortable taking that risk, those bonds rise faster than government bonds. When there is instability in the bond or stock markets, these low-quality bonds will often decline before the stock market weakens or a bear market begins. We haven’t seen any such development yet. A chart of the last four years of this relationship is below. The S&P 500 Index is in the upper panel while the relationship between low-quality bonds and government bonds is shown in the lower panel.
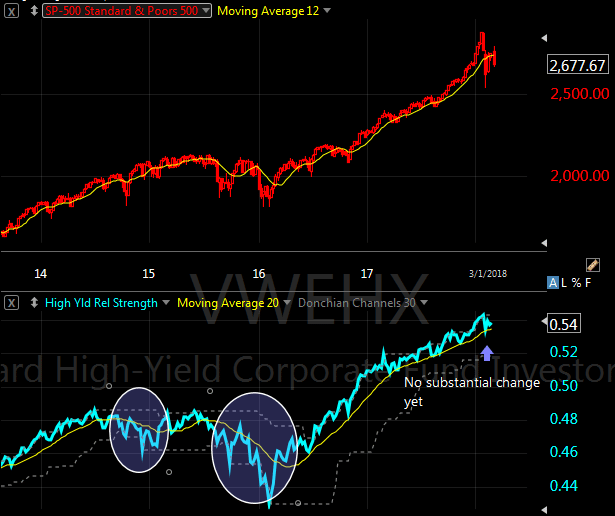
Source: TC2000
Conclusion
More market volatility is likely to occur over the coming weeks. There are a number of positive catalysts and conditions that suggest the US stock market will offer attractive returns this year and we are positioning to take advantage of them. At the same time, each day brings new information which we consider in context to determine if a change in our view is needed. Our goal isn’t to be correct in a thesis we offered previously. We change our view when new data emerges. Our goal is to generate attractive returns for clients while also protecting capital in difficult times.
If you have questions or comments please give us a call or send an email.