BY KENT SHAW, CFA
There are many factors that affect stock market returns but it’s helpful to have a framework where possible to simplify analysis. One such model is the example shown below where the returns of the market are boiled down to three main drivers: P/E expansion, earnings per share growth, and dividends. The P/E, or price-to-earnings ratio, is the price of the market index divided by trailing earnings of the companies within the index. It reflects valuation and also expectations. Over the long term, buying at a lower P/E typically yields larger returns than buying at a higher P/E. At the same time, the current P/E represents expectations on the part of investors. If the majority of investors are cautious about the economy or a company, they will be unlikely to pay a higher price for it (reflected in the P/E) as they may question whether or not profits and the price will improve in the future. Earnings per share represent profits for shareholders and receive most of the focus in the financial press. Finally, dividends represent the portion of company earnings that are paid directly to investors. Dividends tend to vary less than earnings as company management teams are slow to cut dividends because such an action is often viewed as a sign of financial weakness.
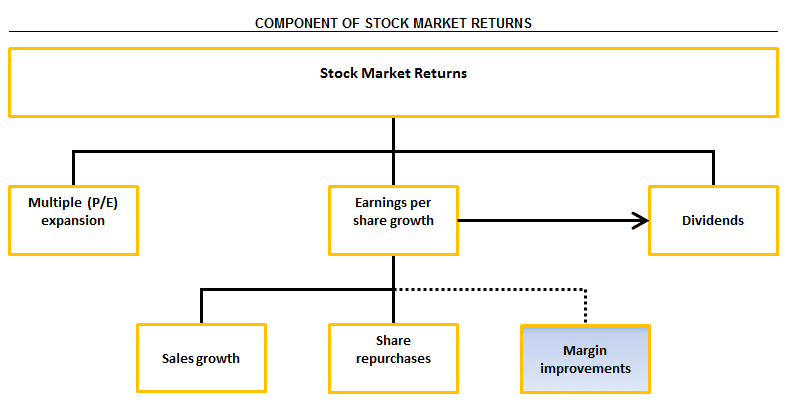
Our discussion this quarter focuses on one of the drivers of growth in earnings per share: margin improvements. The profit margin, or simply “margin”, a company earns is the amount of profit divided by sales. If a company earns 2 cents on $1 in sales the result is a profit margin of 2%. Kroger, one of the largest grocery chains in the United States, has a profit margin of 2%. Kroger’s expenses are high as it must maintain many stores and pay a larger number of employees (more than 400,000). Kroger has limited control over what it can charge for its products because they are easily available at other stores. In contrast
Apple, the well-known technology company, has a profit margin of 23%. Apple tightly controls the prices charged for its products and there are substitutes (other kinds of phones, for example) but Apple has features such as its software which can’t be replicated. It also employs far fewer employees (around 100,000) and only maintains a fraction of the stores relative to Kroger. Before you rush off to buy Apple stock and sell any Kroger or other grocery store stocks you own, remember our discussion earlier about the importance of multiples or what you pay for earnings. Having high profit margins is not a guarantee of strong stock performance. Likewise, having low margins does not mean a stock should be avoided. There are many factors involved in understanding the potential for a company and its stock. Profit margin is but one of many items that we review.
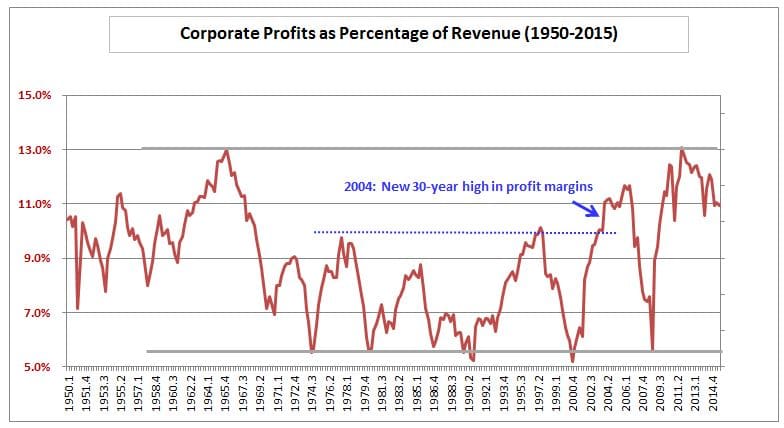
Now, let’s step back from individual companies and consider corporate profits for all companies within the United States. The chart below shows the margin for US companies, public and private, since 1950. For 3 decades until 2004, US corporate profit margins never moved above 10%. From 2004-2006, margins moved above 11%. Again in 2010-2015, margins moved above 11%. We’ll review why in a moment.
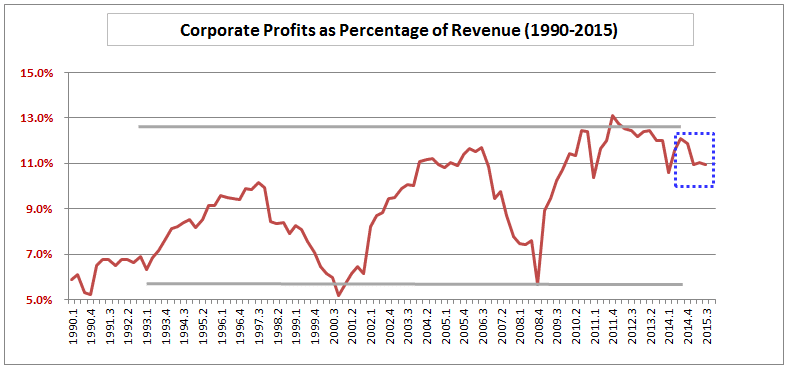
In the current economic cycle, profit margins peaked in Q4-2011 in the data shown below. Earnings continued to grow for most companies as revenue growth was steady and the global economy was generally stable. The blue square shows where profit margins began to decline again throughout 2015. During this period, revenue for the S&P 500 Index declined 2% and companies were not able to reduce costs fast enough to maintain profit margins. For 2015, earnings for the S&P 500 declined.
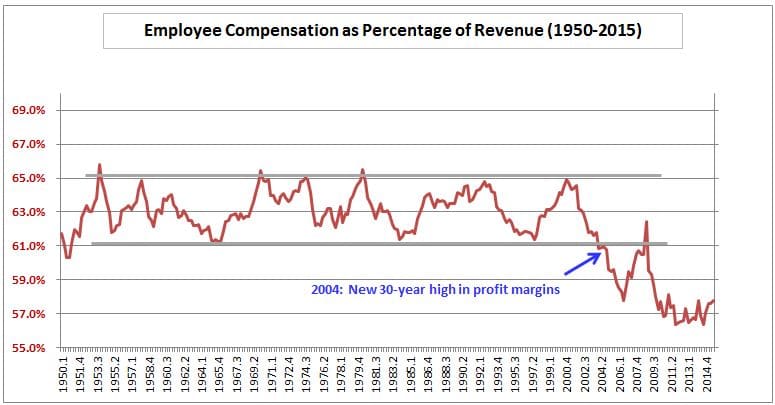
Earlier we discussed how profit margins began to reach new 30-year highs in 2004. The chart below shows employee compensation as a percentage of revenue, or labor cost. From 1950 through 2002, labor cost averaged around 63% of revenue, by far the largest cost of corporations. However, in 2004, labor cost as a percentage of revenue began falling to new lows and, with the exception of an increase for several years due to declining revenue in a recession, it has remained low.
It is difficult to determine the exact cause of the decline but we estimate the increase of software and technology reduced labor demand and its associated cost. The practice of “offshoring” or outsourcing certain functions to countries with lower labor costs is also a significant factor. This has occurred in higher wage service sectors as well as in manufacturing. What’s next? For the past 12 months, wages have been rising steadily. We believe that most savings that could occur from offshoring have already taken place and now many companies are scrambling to find qualified workers as evidenced by the low unemployment rate. As this trend progresses, wages should continue to rise and profit margins will likely decline making earnings growth for the average company more difficult. The timing of these changes, however, is difficult to forecast.
This information suggests that the average company will have difficulty improving its margin over the next few years and that the stock market, as a whole, may be challenged. However, we think there are companies that have much more control over their costs and profit margins that may do well and we continue to look for such companies for the benefit of our clients.