
Gold has been used as a unit of value and for commerce for centuries. Since the days of the rampant inflation in the 1970’s, whenever inflation is discussed, the idea of gold as an investment becomes a topic of discussion. For the last 20 years, inflation has been very low relative to history but now that government spending has accelerated as a response to the COVID pandemic, the gold question is bubbling back to the top of the bowl.
Many investors have a sense that gold may be worth investigating as something to add to their portfolios but may be relying on “common sense” rules such as gold rises with inflation or gold performs well when the market drops. There are very few principles of investing that are always true so beware of such investment assertions by professionals, golf buddies, and your dentist. There are some helpful principles that are often true but most investors I admire use multiple types of analysis at once to arrive at decisions. Such decision-making helps protect against the moments when your favorite principle fails to perform as expected. Diversification within a portfolio is a good idea and it is also a good idea regarding investment methods.
In this brief article we will take a look at how gold impacted the performance of a hypothetical portfolio over the last 39 years (1982-2020). This is not a recommendation and we believe it is important to understand why a specific method or principle works so a decision can be made not just based on history, but based on the information presented at the time. As a reminder, in the 2005-2008 real estate crash in the United States, many well-paid professionals asserted that an investment in a basket of mortgages from around the country couldn’t lose money because it was so well diversified. Such assertions proved to be painfully wrong. Now on to the numbers!
 Source: Bloomberg
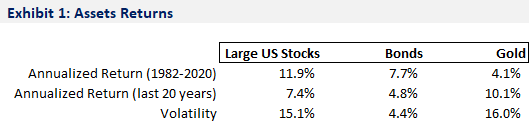
In Exhibit 1 (above), we see the annualized return for US large stocks (represented by the S&P 500 Index), bonds (represented by the Barclay’s Aggregate Bond Index), and gold (data from the futures market). I have listed the return for the entire period as well as the last 20 years because the last two decades have seen a notable increase in intervention by the Federal Reserve Bank in times of economic and capital market turmoil so a second snapshot of the data seems wise to determine if significant changes in performance have occurred. Volatility is often used as a proxy for risk so let’s compare. Stocks have the highest return but also very high volatility compared to bonds. Gold has the highest volatility but the lowest return since 1982 yet it also has much higher return over the last 20 years.
For purposes of comparison, we’ll assume Portfolio 1 contains 100% stocks. This would be an aggressive allocation and unwise for most investors that are reliant on the portfolio for living expenses but it will help with comparisons. Adding assets to a portfolio that are not highly correlated can reduce volatility and may improve returns over time. Let’s look at a few portfolios to see what occurred.
Source: Bloomberg, MONTAG
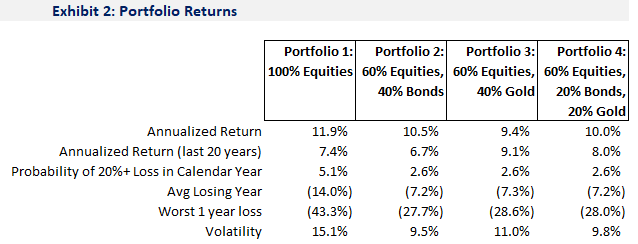
Exhibit 2 (above) shows 4 different portfolios ranging from a single asset in Portfolio 1 (stocks) to three assets in Portfolio 4 (stocks, bonds, and gold). It’s important to note that while stocks have risen steadily, with many ups and downs, over the last 40 years, bonds have also enjoyed a mostly rising environment due to the steady decline in interest rates since the high inflation and interest rate period in the 1970’s. (Bond prices rise when interest rates decline). To assume that bond returns for the next 40 years will look similar would be a mistake given the lower starting point for interest rates.
Our data above show some new information compared to Exhibit 1. In the absence of other information, volatility is a good proxy for risk but it is incomplete. Volatility tells us how returns vary around the average but most investors don’t mind positive variance or unexpectedly large positive returns. However, large negative returns can be a problem. To the extent possible, we’d like to have an estimate of how probable such negative events might be. The table shows (starting in the third row) the probability of the portfolios experiencing a loss of 20% or more, the average return in a losing year, and the worst 1-year loss.
A few numbers might appear surprising. First, the annualized return across all portfolios is not dramatically different. The all stock portfolio (Portfolio 1) does have the highest return but it is only 2.5 percentage points higher than the lowest return portfolio (Portfolio 3). This is stark given that gold during the entire period offered a return that was 7 percentage points lower than stocks. Is this magic? Well, not exactly. It’s diversification. The gold in the portfolio performed well in some periods when stocks performed poorly allowing the decline in the portfolio to be less than it would otherwise have been if it had only owned stocks. Note that a 40% allocation to gold is very high and we use it here only as a comparison and replacement for bonds in Portfolio 2. The second observation is the much better risk measures for portfolios 2 through 4. In each, the average losing year is roughly half of the all stock portfolio and the worst 1-year loss is about 15 percentage points better. Gold does offer a benefit by lowering risk in a similar manner to bonds. In Portfolio 4, where bonds and gold are used, the return over the last 20 years is actually higher than stocks. Portfolio 4 offered a return of 8.0% versus 7.4% for stocks (row 2 of the table). Portfolio 3, with bonds and stocks, also outperformed the all stock portfolio in the last 20-year period. How did this occur?
Source: Bloomberg, MONTAG
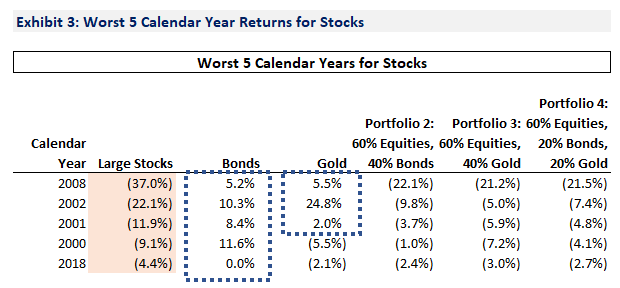
Finally, Exhibit 3 (above) shows how Portfolio 3 outperformed the all stock portfolio over the last 20 years. The exhibit shows the worst five calendar years for stocks over the last 40 years. Note that all of these occurred in the last 20 years. During each of these years, bonds produced a positive return, in some cases a very positive return while stocks experienced a loss. In three of the five years, gold also had a positive return with the year 2002 showing a large gain. In the remaining two years, gold did have a loss but it was small. Each of these other assets, bonds and gold, tend to offer positive returns when stocks experience a loss during the evaluation period. Such behavior allows a portfolio to lose less when market turmoil occurs which in turn enables the portfolio to recover more quickly and begin producing a positive return. The ability of a portfolio to recover from a loss is especially important when it is used to provide cash for living expenses. Bonds often offer positive returns when stocks are weak because investors fear further losses when stocks begin declining and many sell stocks and purchase bonds for relative safety. In recent decades, the Federal Reserve Bank has often lowered short-term interested rates when the economy and stock market weaken. Lower rates lead to higher bond prices as do high demand from safety conscious investors.
At MONTAG, we believe the asset allocation decision is an important tool to manage risk and do not advocate a static allocation like the hypothetical portfolios shown here. We believe that perfect market timing is impossible but steering a portfolio from the fast lane to the slow lane based on market and economic environment can add value over time.
The information provided is for illustration purposes only. It is not, and should not be regarded as “investment advice” or as a “recommendation” regarding a course of action to be taken. These analyses have been produced using data provided by third parties and/or public sources. While the information is believed to be reliable, its accuracy cannot be guaranteed.