What correlation can say about the markets
The stock market, at least measured by the S&P 500, had a steady and mostly linear climb through 2017 and into 2018. However, the return of volatility was only a matter of time, and markets went through a very turbulent few days in early February 2018 as we began to realize that volatility. In the run up in the equity markets in 2017 it’s easy to say that “all ships rise with the tide” and equities must have been moving together for a reason. Similarly, in the choppier waters we have now, some investors may think that everything is suffering the same thing, at the same time, and on the same scale.
But is that true?
The concept of correlation might be helpful to answer that question, and understanding it, at least on a basic level, may also help explain the differences between active investing (which is what MONTAG does) and passive investing (which is what indexing is meant to provide).
Correlation is a statistic that basically measures how closely two securities, in this case stocks or stock sectors, move in relation to one another. Correlation is measured on a scale from 1.0 to -1.0. That is, two stocks that move EXACTLY alike will have a correlation of 1.0. Two stocks that move exactly OPPOSITE of each other will have a correlation of -1.0. And stocks that move based on factors unrelated to each other will have a correlation of 0.0.
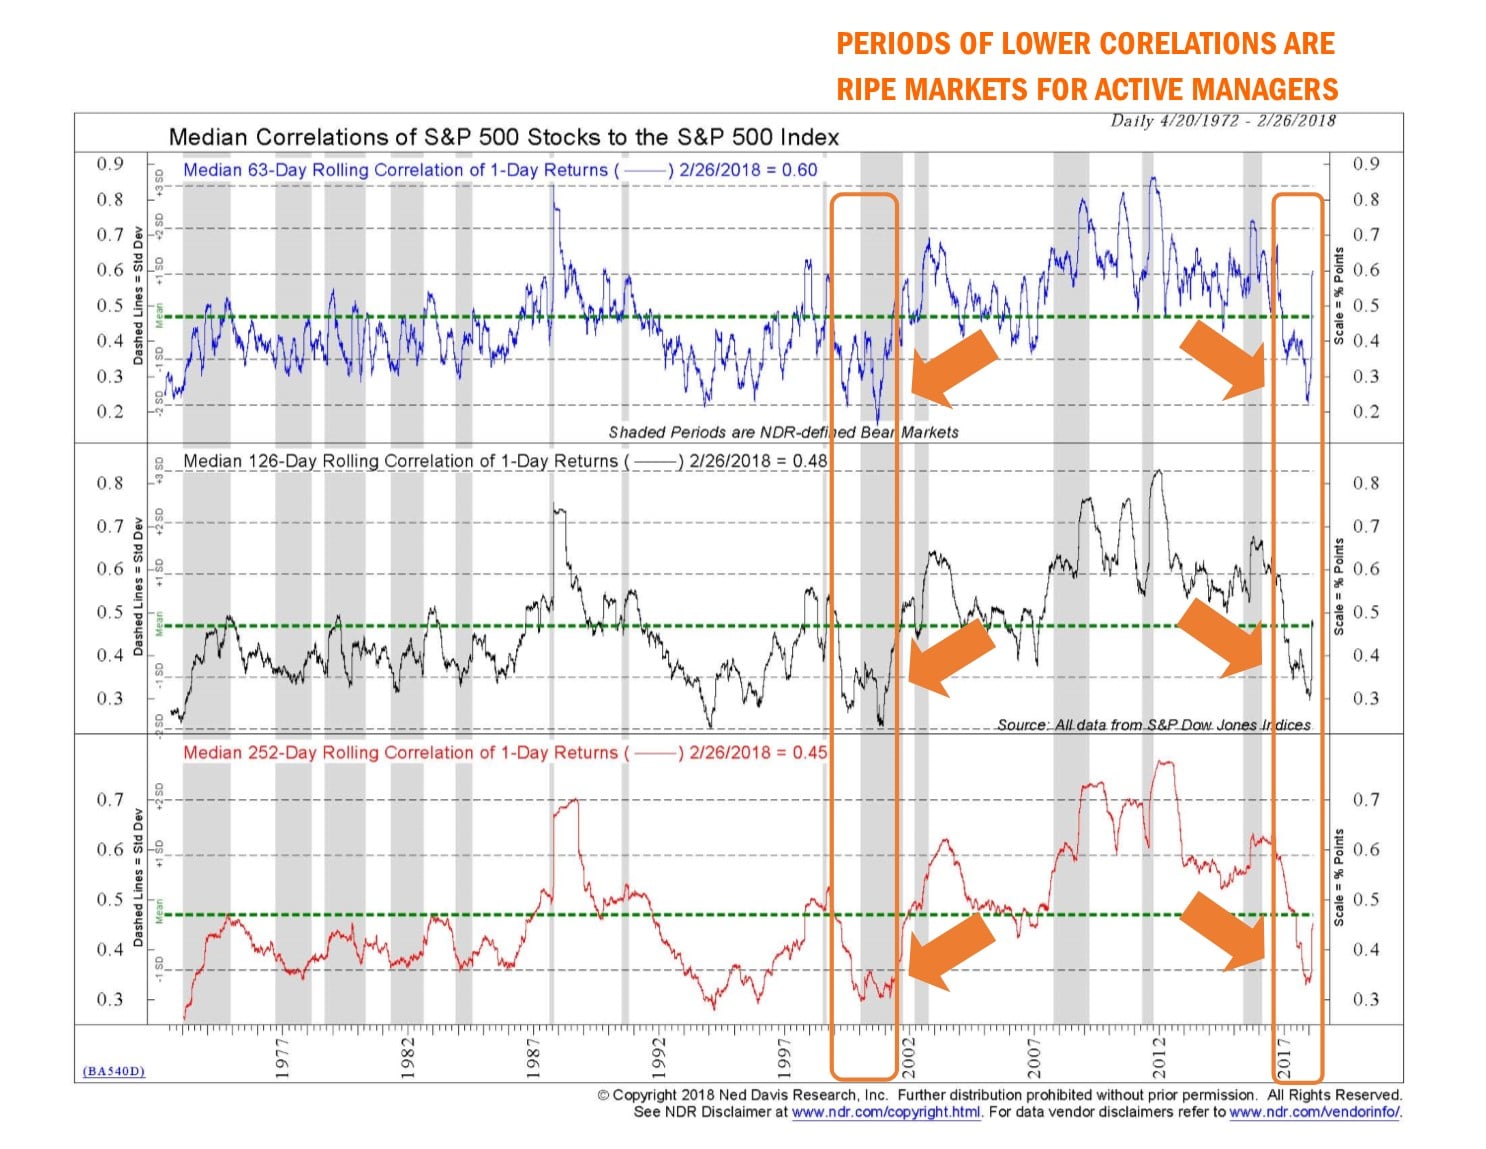
By the end of 2017, market sector correlations were at a 17 year low, according to seekingalpha.com. Further, the following Ned Davis Research chart shows how correlations of all the stock returns for each stock in the S&P 500 were also at lows not seen since 1999-2000:

Low correlations are a positive for ACTIVE investment managers, like MONTAG, because when equities move independently of each other, it creates a better environment for stock pickers. That’s not to say it’s easier to identify winning stocks, but active investing is rewarded when you DO find the winners vs. the losers, because in a high correlation environment even the losers window dress well. To corroborate this concept, a recent study by Bank of America in February of 2018 mentions that, during 2017, 48% of active managers outperformed their benchmarks thanks to the favorable stock picking environment.
Conversely, passive investing works better in a high correlation environment. Not only do you have the benefit of having securities moving together (hopefully upward), but it takes away the need to consider selecting securities that you may have underweighted in low correlation environment, when winners and losers are held further apart. But in the environment we are in currently, the ability to tactically weight (and underweight) the sectors of the market is an advantage of an active investment approach.
It will be interesting to see in 2018, as volatility begins to trend back to a normalized level, if correlations follow suit.
