by Chris Guinther – Senior Investment Strategist & Portfolio Manager
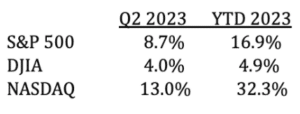
Let’s begin by noting the 2023 second quarter market numbers, as of the quarter’s close of June 30th.

An especially revealing statistic was the FANG+ index (Facebook, Apple, Netflix, Google, and other tech/growth bellwethers) which was up over 70% for the first 2 quarters.
In general, then, it seemed like a great half-year for risk investors. Looking a little closer though, most investors will be disappointed in their returns relative to those major indices because the ‘average stock’ as measured by an ETF we watch, the RSP, was only up 6%. RSP (Invesco S&P 500 Equal Weight ETF) is a better measure and more realistic view of ‘how are stocks doing’ as it equally weighs the largest 500 companies in the U.S. so as to not be too influenced by the mega-caps companies like Microsoft, Apple, and Amazon.
A look at the Russell 2000, a broad index of all small caps working across all industries in the U.S. was up just 7.3%. What has happened was the mega cap technology firms like AMZN, MSFT, TSLA, NVDA, META are so large now that they really carry and influence the performance of the S&P 500 index that is so closely watched. Even the Dow Jones Industrial Average was up just 4.9% YTD.
Putting all of this into perspective is a key to understanding individual returns relative to the real dynamics of the markets. (Stay tuned: This will all be explained in more depth in a blog post by CEO Ned Montag, “Lessons from Mark Twain”, to be posted next week.)
We have not seen a meaningful move higher in corporate expected earnings which is a necessary ingredient for sustainable stock price moves. What we have seen is an increase in valuations (PEs) without notable improvements in forward-looking indicators of the economy. Artificial Intelligence (AI) excitement seemed to contribute to some of the mega-cap stocks extreme upward moves that significantly contributed to the major index gains as well.
How the 2nd half of the year performs will depend on whether a US recession starts later in the year as the lag effect of aggressively tighter monetary policy (higher interest rates and tighter bank lending policies) that were instituted over the last year or so. Economists agree that it takes 12-18 months before the moves designed to slow demand/curb inflation are felt, so we continue to monitor and adjust our thinking as the data presents itself.
Historically, we have rarely experienced a time when the FED was tightening with such vigor that they haven’t overdone it and caused a recession. Combine the FED risk with very tight bank lending policies that are in place now, add to that excessively low unemployment and we arrive with an informed opinion that risks are high that the U.S. enters a recession towards the end of this year.
It’s of course possible that the FED’s campaign to end inflation accomplishes just enough cuts in spending and demand by consumers that the economy gets back to perfect balance, but only time will tell. At MONTAG, we want to err on the side of caution to minimize exposure to large drawdowns. The fixed income allocation of our portfolios provide a level of stability while we allow the dynamics of the FED’s policies to work their way into the system.
We believe a world of “higher for longer” interest rates and slower growth than the last four years is much more likely than a return to the abnormally low interest rate environment when high growth stocks dominate and high valuations were the norm.
In general, we continue to position client accounts conservatively to allow for a wide range of possible outcomes given the unprecedented inflation and withdrawal of stimulus that is occurring worldwide.
* * *
The information provided is for illustration purposes only. It is not, and should not be regarded as “investment advice” or as a “recommendation” regarding a course of action to be taken. These analyses have been produced using data provided by third parties and/or public sources. While the information is believed to be reliable, its accuracy cannot be guaranteed.
Any securities identified were selected for illustrative purposes only. Specific securities identified and described may or may not be held in portfolios managed by the Adviser and do not represent all of the securities purchased, sold, or recommended for advisory clients. The reader should not assume that investments in the securities identified and discussed were or will be profitable.
