We recently passed the 10 – year anniversary of March 9, 2009, when the S&P 500 Index reached its panic-driven 666 intra-day low. What an extraordinary ten years since that bottom, with the index returning a 10-year compound annual growth rate of 17%. For comparison purposes, the preceding decade (March 1999 to March 2009) was not nearly so rewarding for investors. In that decade, the S&P 500 Index produced a negative 4.5% annualized return from March of 1999 through March of 2009. What a difference a decade makes as valuations, economic conditions and sentiment looked very different at the beginning of these two periods. The more pressing question is where are we now, 10 years later, and what lies ahead? While a detailed comparison of the three periods is beyond the scope of this short blog post, a few points regarding economic growth, interest rates and valuations are worth highlighting as in some respects.
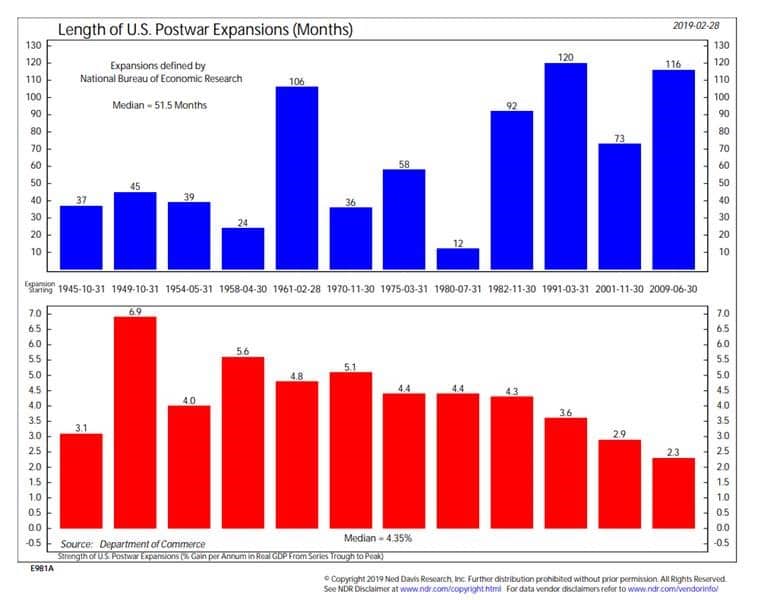
The Great Financial Crisis and its aftermath were extraordinary. Some thoughtful economists hypothesized that we were entering a “new normal.” They theorized that excessive amounts of consumer, corporate and government debt would hobble economic activity, serving as a ceiling to any recovery and keeping global interest rates low for many years to come. Unlike some economic projections, this one was correct. Looking back, we see that while this economic expansion has persisted for an unusually long period of time, it has done so with little vigor. The chart below from Ned Davis Research (NDR) shows that 116 months into this expansion, the % gain per annum in real GDP has been 2.3%, much lower than other periods of economic growth. However, time alone does not necessarily end this run, and the lack of concentrated excess today (in contrast to the technology capital spending cycle from the late 1990’s and the housing cycle in the 2006-07 period) may mean that we can continue on this slow economic growth path for a while longer.
10 years post-crisis interest rates are still very low. While the fed funds rate began to rise as a result of several short-term rate increases by the Federal Reserve over the last few years or so, today the 10 year treasury bond yield is at 2.6%, still virtually unchanged from March 2009 and a far cry from the robust 6.4% yield back in March 1999. These low nominal 10 year Treasury yields are the bond market’s reflection of a low growth world. Curiously, the shape of the yield curve itself resembles that of the late 1990’s, with only a small difference between short term and long term interest rates. This flat yield curve encapsulates bond investors’ view that economic growth will be weak and inflation low for the foreseeable future.
With respect to valuation measures (namely the P/E ratio), they are neither as low as 2009 nor as expensive as 1999. According to the NDR research group, the median P/E for companies in the S&P 500 Index is around 22x today, substantially higher than 2009’s panic-driven low-teens multiple, but also not the giddy high-20’s reached in the late 1990’s. The level of interest rates is an important driver of valuations, and the persistently low rates of the past decade have served to keep multiples higher for longer than anyone expected.
Another key driver in this unique cycle is the record level of corporate profit margins. Much has been written about this phenomenon in recent years, with some believing that a reversion to the mean is way overdue, while others arguing that margins levels are more sustainable than they have been in the past. Some of the record profitability is cyclical in nature, and margins may be pressured lower in time due to rising labor costs and cooling economic activity. However, other margin drivers are substantially structural and permanent. Increased trade and globalization of corporate supply chains has been a big driver of improved profitability this cycle. These trends are unlikely to change overnight (granted, talk of tariffs on Chinese goods last year created a lot of uncertainty regarding the sustainability of this benefit). Lower borrowing costs and tax rates have also been big contributors to higher margins over the years, and corporations’ muted capital spending has been critical to the growth and persistence of higher margins. Not wanting to stick their proverbial necks out, companies have chosen to keep new investments and expansions to a minimum, instead accumulating free cash flow and spending it on debt reduction and stock buybacks. The bigger question is how long can this record profitability persist? Is this our “new normal” or are we about to experience a regression to the mean? The answer is probably somewhere in between given the mix of cyclical and structural influences. We are likely to see some deterioration in the coming years, but not to the extent as in the prior cycles.
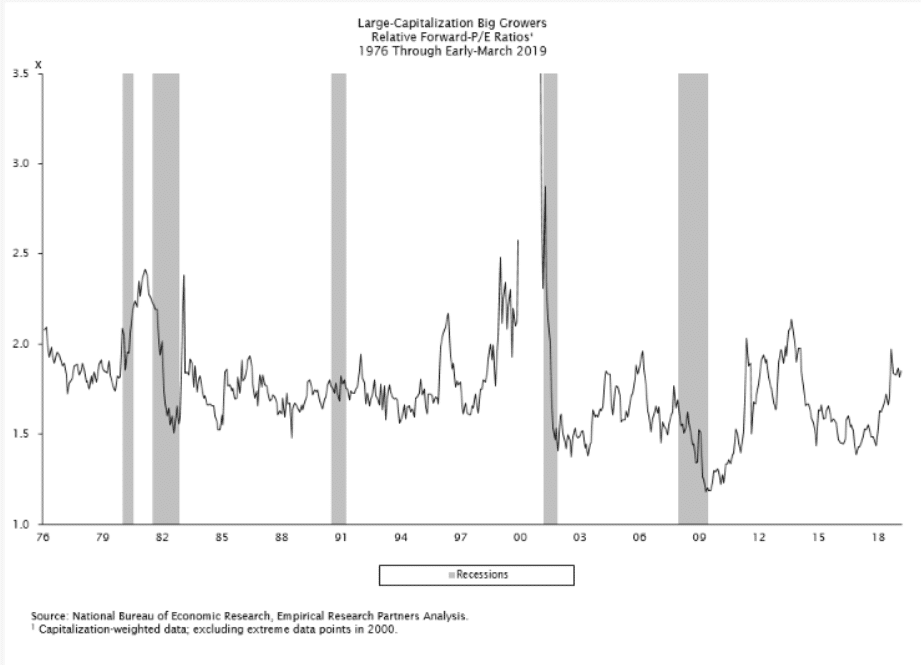
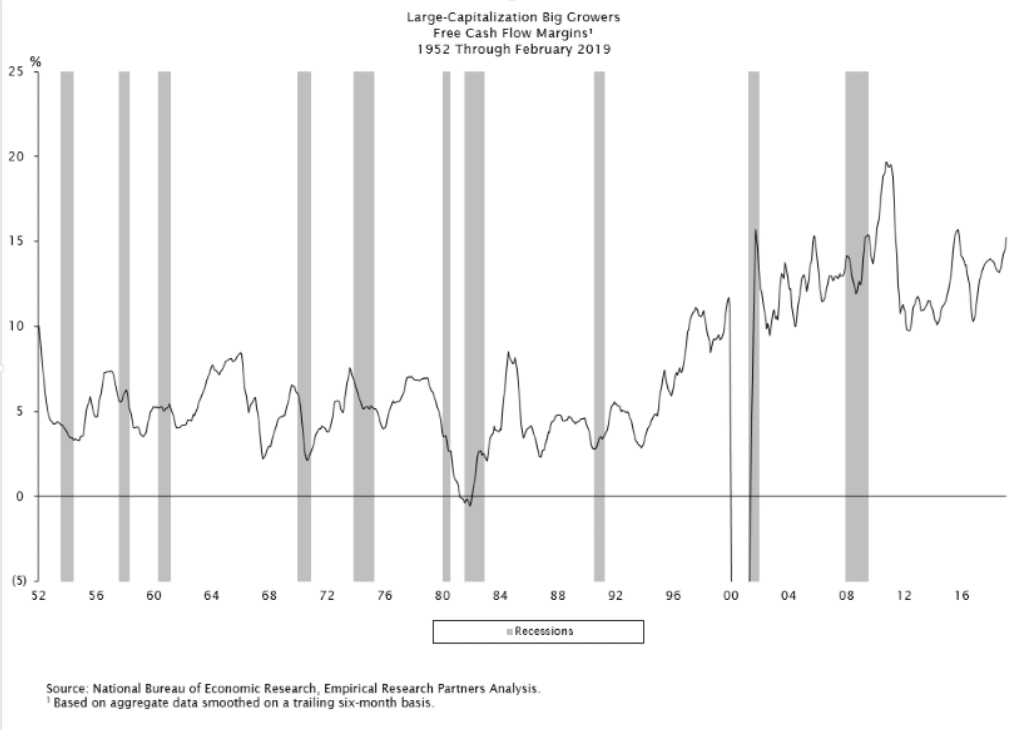
Corporate margin trends aside, there is one interesting resemblance to the late 1990’s. Empirical Research Partners (ERP) recently shared a provocative analysis of the returns and valuations of the big growth companies from back in the late 1990’s to those of today. As we all know, technology stock and big growers have been a dominant leadership theme over the last several years with the Russell 1000 growth outperforming Russell 1000 value by a very large margin since 2017, with the biggest positive returns going to the fastest growers, just like in the late 1990’s. According to ERP, relative valuations of these fast growers are approaching the prior peaks. However, the one positive difference between now and back then, is that at present the free cash flow margin generated by these fast growers is around 15%, a good bit higher than they were 20 years ago, hence, these companies are much more profitable now justifying these elevated multiples, much more so than 20 years ago. (The following 2 charts are courtesy of ERP, whose data sources are noted accordingly)
As you have read here, these indicators all paint slightly different pictures, although none of them yield any indication of a sharp reversal. Some things, like margins, will come down at some point, or interest rates could go up at some point (or pause again). I guess you could say that we are in the New Normal… until things change and we are in the New New Normal! Stay tuned.
NOTE: The information provided is for illustration purposes only. It is not, and should not be regarded as “investment advice” or as a “recommendation” regarding a course of action to be taken. These analyses have been produced using data provided by third parties and/or public sources. While the information is believed to be reliable, it’s accuracy cannot be guaranteed.