INTRODUCTION
The adage “buy low, sell high” is a simplification of how to build wealth in the investment market. To buy low is to identify investments that are inexpensive, or “cheap” and then hold them until (or selling them when) they become “expensive”. But how is a “cheap” investment measured? And once measured, how can one determine if it is “cheap”; is it an absolute or a relative measurement?
In Part One of our blog series entitled “What Is ‘Cheap’ and How Do You Know?” we discuss various metrics used to measure “cheap” stocks, and some of the strengths and weaknesses of each.
BACKGROUND
One of the greatest determinants of an investment’s return over the long term is the “valuation” for the investment at the time of purchase. In a famous study by Professors Fama and French (1992), it was shown that valuation was a far greater determinant of return than volatility, which is a commonly accepted proxy for risk. Prior to the Fama-French study, it was assumed that riskier assets, as measured by price volatility, would produce greater returns. While this is true in general, the stock market is full of exceptions and some of them are quite persistent. We hope to discuss some of these exceptions in the future.
If you believe in the axiom “Cheaper is Better”, then it stands to reason that using a measure of valuation will allow us to compare “cheap” securities to “expensive” securities. So how does one measure the valuation? Unfortunately, there is no easy answer.
It is widely accepted that the value of an investment should be the present value of the cash flows the company will generate in the future. The future cash flows are discounted or reduced to reflect the risk of the company. This is precisely how the value of a bond is calculated. However, the cash flows for a company are much more difficult to forecast than those of a bond. These discounted cash flows are summed to determine the value of the entire company and then all debts are subtracted from it to reach the value of the equity, or the portion owned by stockholders. This type of model is called a discounted cash flow or DCF model. Building a DCF model is time consuming and many investors use valuation multiples as a shortcut. Shortcuts can be useful in some cases but they also pose risks of error.
As we discuss below, several of these multiples, or ratios, have been used as a measure of valuation, but none of them are flawless in their application.
RATIOS USED IN VALUATION
The Price-to-Book (P/B) ratio
Fama and French used a ratio of stock price to the book value, or accounting value, of the company’s assets, often referred to as a Price-to-Book ratio or P/B. This ratio may be helpful in reviewing thousands of companies at once, but P/B ratios can be skewed by a number of factors. One of the biggest factors that can contribute to the distortion of the P/B ratio is the repurchase of a company’s shares.
Most investors applaud when companies repurchase stock as they see it as a safe use of capital that adds value. When a company repurchases stock it reduces the number of shares outstanding and reduces the amount of equity. Book value is another name for equity and it drives the “B” in the P/B or Price-to-Book ratio. After the repurchase, if the stock is the same price, the P/B ratio will be higher because there is less “B” or “book value” in the ratio.
In this example, the operations of the company haven’t changed at all and the price hasn’t moved but the Price-to-Book ratio is higher because of the repurchase. The action results in a valuation distortion that makes the ratio less representative of value. The earnings capacity of the company hasn’t changed at all. This can be especially troublesome when comparing a company’s current P/B ratio to its long-term history. If the company has consistently repurchased stock over the years comparing a P/B value of 1.5 to the same value 5 years ago isn’t as meaningful.
The chart below illustrates the distortion clearly. From early 2002 (circled) to early 2006, the P/E ratio (left scale) fell from 20 to 16, a 20% decline, while the P/B ratio (right scale) more than doubled from 1.5 to 4.0. One metric says the stock is cheaper while the other says it is much more expensive! What happened?? Between 2001 and 2007, Bank of Hawaii spent $1.4 billion repurchasing stock, almost 15% of the stock each year, which reduced shares and reduced equity or book value. This reduction caused the P/B ratio to rise significantly.
Chart 1: Bank of Hawaii (BOH)
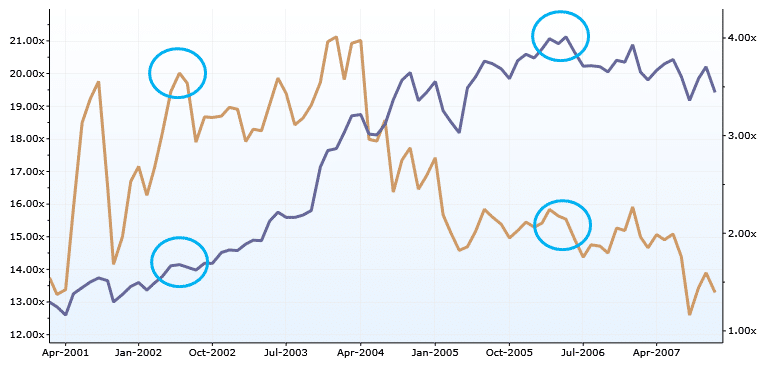
Source: S&P Capital IQ
The reason for the different effect on the ratios is that book value per share is in the denominator for P/B while earnings per share is in the denominator for P/E. Share repurchases reduce book value per share causing the P/B ratio to rise while repurchases increase earnings per share causing the P/E to fall. During the period in the above chart, earnings per share increased by a total of 165% while book value per share declined by 6%.
The P/B multiple is most appropriate for companies in the financial sector such as banks and insurance companies where debt is a regular part of the balance sheet and is held by all companies in the industry. Companies that finance their customers’ purchases and keep those loans on the company balance sheet, such as car dealerships, should also be viewed in a Price-to-Book framework. Even in these circumstances, it is important to understand the distortions we highlighted and how they may make the current P/B value less comparable to the same value in the past.
The Price-to-Earnings (P/E) ratio
Price-to-Earnings ratio, or P/E, is a valuation ratio most familiar to investors, and therefore is the most often used by investors as a measurement of valuation. The P/E ratio does have the benefit of being easy to calculate and easy to find in most financial publications and websites. However, the P/E ratio’s ubiquity doesn’t necessarily make it the most useful or representative of reality.
I have spent more than a decade examining the use (and usefulness) of the P/E ratio, and I have an opinion on when this ratio is appropriate and works, and when it is not appropriate and not applicable to the analysis of a company. It’s fair to say that it is probably best used in large, well established companies that have an extensive operating history (20+ years) and a consistent balance sheet. Unfortunately, this is not the only way in which the P/E ratio is used.
WILL THE REAL TAX RATE PLEASE STAND UP?
One of the largest factors that can skew the P/E ratio is taxes. The earnings used to calculate the “E” in the P/E ratio are accounting (i.e.,GAAP) earnings, not actual cash produced by the company. GAAP stands for Generally Accepted Accounting Principles and represents the rules that U.S. companies must follow when calculating their financial statements.
There is often a difference between the amount of GAAP taxes reported and the amount of actual cash taxes paid. The difference is largely caused by deductions that reduce the GAAP tax rate much like a mortgage interest deduction reduces the income tax rate for an individual. Some of the largest factors that reduce cash taxes are research and development tax credits, tax benefits of investing in new equipment, and profits from outside the U.S. where tax rates are lower.
If we look at the top 20 largest companies in the S&P 500 over the last 5 years we see there is definitely a difference between their cash tax rates and their GAAP tax rates. For the last 5 years, most companies on the list reported cash tax rates below GAAP tax rates. If we view cash produced by a company as being more important than earnings, it’s important to know that the P/E ratio would not reflect the larger amount of cash produced by a company due to lower taxes in that case. The P/E would make the company look more expensive than if cash taxes were used.
In the table below, we see that Apple has had a cash tax rate that was 10 percentage points lower than its GAAP tax rate over the last 5 years. That’s a notable difference. A difference of this size would result in the earnings being 15% higher if the cash tax rate was used and the P/E being 2 points lower if the resulting earnings were used in a P/E calculation, all other factors being equal. This is not a recommendation to buy Apple stock but rather an example to illustrate the impact of the differences presented here.
Chart 2: Difference between GAAP and cash tax rates
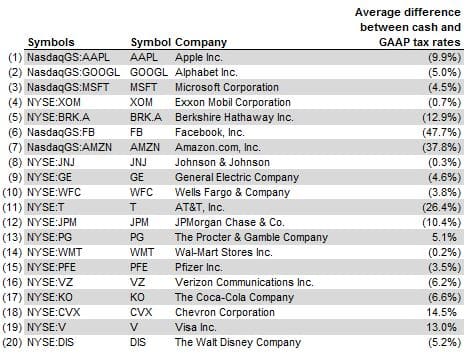
Source: S&P Capital IQ
SUMMARY
Both the P/B ratio and P/E ratio are commonly accepted ratios used in the valuation of equity investments, but they can both be heavily skewed by management choices (i.e., share repurchase programs) or accounting phenomena (i.e., disparity in tax rates).
In two future parts of our blog series (Part 2 & Part 3), we will discuss other factors that may distort the P/B and P/E ratio. We will then provide a third valuation ratio that we consider to be the most appropriate to use in the valuation of equity securities in non-financial sectors, the enterprise value-to-EBITDA ratio. Finally, we will provide an example that compares the sensitivity of the P/B and P/E ratios against the more robust enterprise value-to-EBITDA ratio.